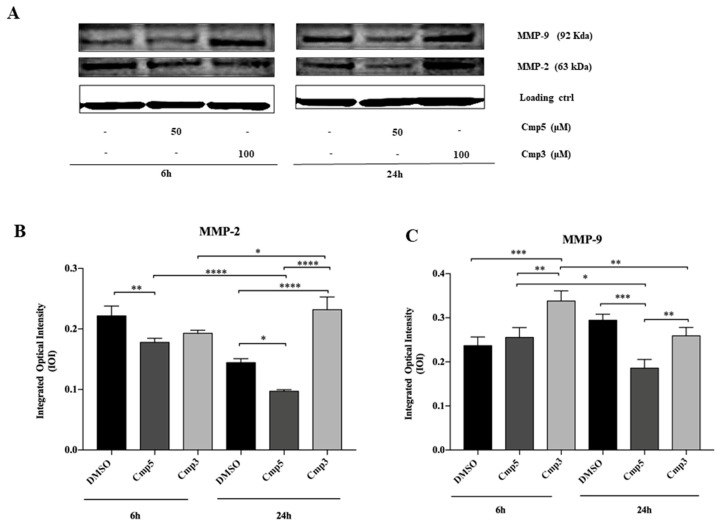
Figure 10.
Western blotting analysis of MMP-2, MMP-9 expression in rat C6 glioma cell lines treated with Cmp5 and Cmp3. (A) Cells treated with DMSO (0.2%) were loaded as negative control. Each membrane has been probed with β–actin antibody to verify loading consistency. Western blot is the most representative of three different experiments. (B,C) Histograms represent densitometric measurements of proteins bands expressed as integrated optical intensity (IOI) mean of three separate experiments. The error bars on these graphs show standard deviation (± SD). **** p < 0.0001, *** p < 0.0002, ** p < 0.0005, * p < 0.005.

