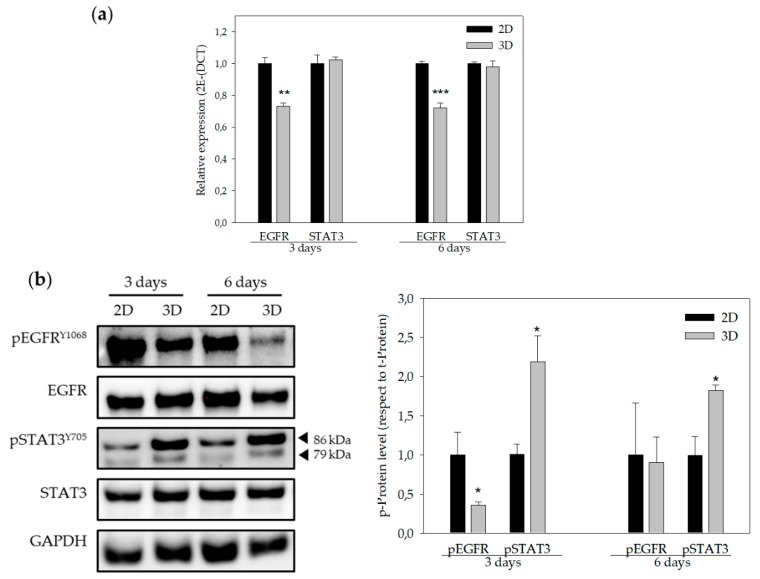
Figure 5.
EGFR and STAT3 genes expression and protein levels. (a) EGFR and STAT3 gene expression of MDA-MB-231 cells cultured in 2D (black bars) and in 3D (grey bars) using 15% PLA scaffolds over three days (left) or six days (right). (b) Quantification of protein levels (EGFR and STAT3) obtained by Western blot analyses (right panel) of MDA-MB-231 cells cultured in 2D (black bars) and in 3D (grey bars) using 15% PLA scaffolds over three days (left) or six days (right). Results are expressed as the ratio of activated protein (p-Protein) vs. total levels of protein (t-Protein). Experiments were performed at least three times. * (p < 0.05) indicates levels of statistical significance. For an easier interpretation, the value obtained for cells cultured in 2D was adjusted to 1 and that of the 3D-cultured cells was calculated based on this.

