. 2019 May 23;11(5):916. doi: 10.3390/polym11050916

Table 4.

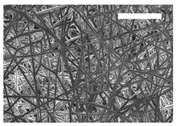
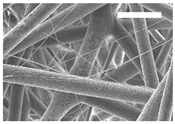
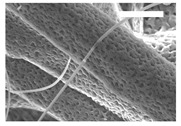
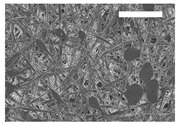
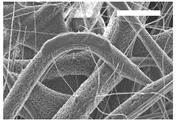
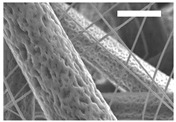
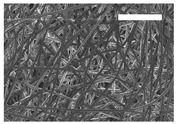
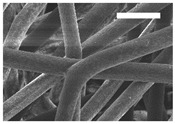
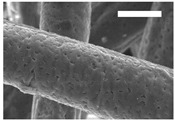
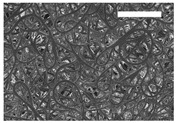
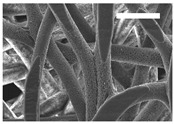
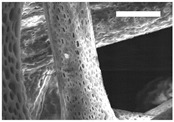
Microscopic characterization of 12% and 15% electrospun (ES)-PLA scaffolds (7 kV, 5 mL/h). Micrographs from the top and bottom sides at different magnifications were visualized using SEM.

12% PLA Side Magnification
200× 1500× 5000×
Top graphic file with name polymers-11-00916-i001.jpg graphic file with name polymers-11-00916-i002.jpg graphic file with name polymers-11-00916-i003.jpg
Bottom graphic file with name polymers-11-00916-i004.jpg graphic file with name polymers-11-00916-i005.jpg graphic file with name polymers-11-00916-i006.jpg
15% PLA Top graphic file with name polymers-11-00916-i007.jpg graphic file with name polymers-11-00916-i008.jpg graphic file with name polymers-11-00916-i009.jpg
Bottom graphic file with name polymers-11-00916-i010.jpg graphic file with name polymers-11-00916-i011.jpg graphic file with name polymers-11-00916-i012.jpg
Scale bars: 150 µm Scale bars: 20 µm Scale bars: 6 µm