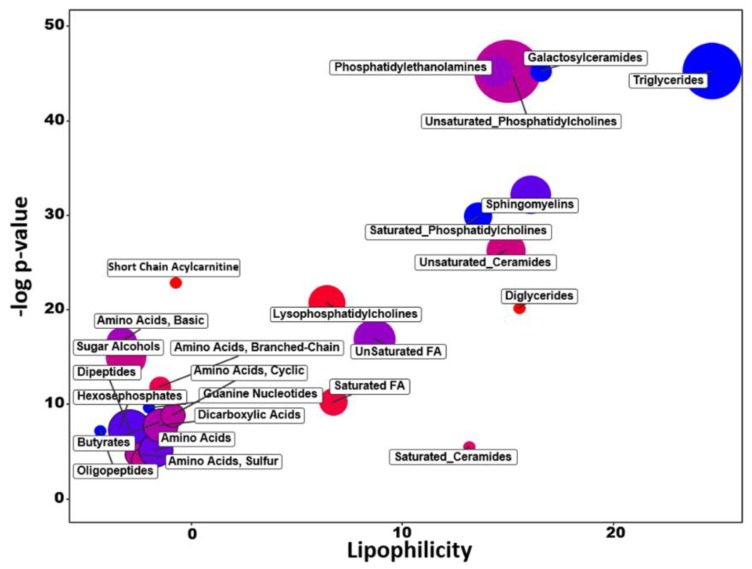
Figure 3.
ChemRICH analysis in LASCPC-01 compared to LNCAP cells. Y-axis: significance of enriched sets of metabolites (FDR < 0.05); X-axis: average lipophilicity of sets of metabolites (cluster colors give the proportion of increased compounds in the LASCPC-01 cell line, red = increased levels in LASCPC-01 cells, blue = decreased levels in LASCPC-01); and circle size: number of detected compounds in this cluster.

