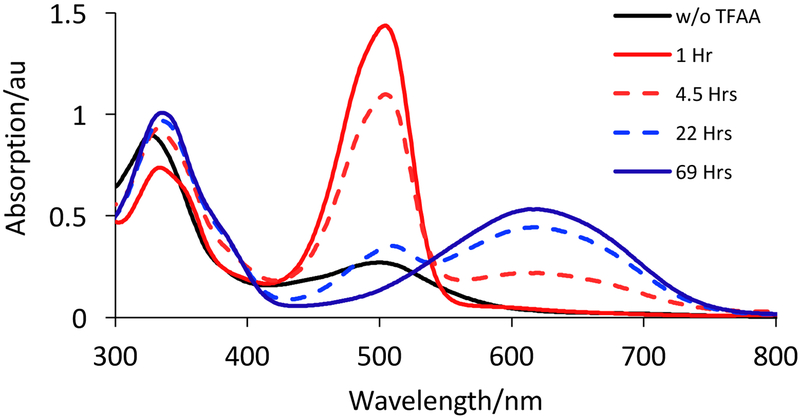
Figure 11.
UV-Vis spectroscopic monitoring of reactions resulting from the protonation of 2 over 69 hours upon addition of 1 eq. of TFAA. Black line: initial spectrum of a 15 μM solution of 2. Red solid line: 505 nm absorption associated with the initial product and is assigned as the ILCT transition from formation of a short-lived pyrano-quinoxaline complex 7 (Fig. 12). Red dashed line: decay of 505 nm absorption of 7. Blue dashed line: growth of a 619 nm ILCT absorption of a previously reported pyrroloquinoxaline complex 8 (Fig. 12). Blue solid line: complete formation of 8 from 7.

