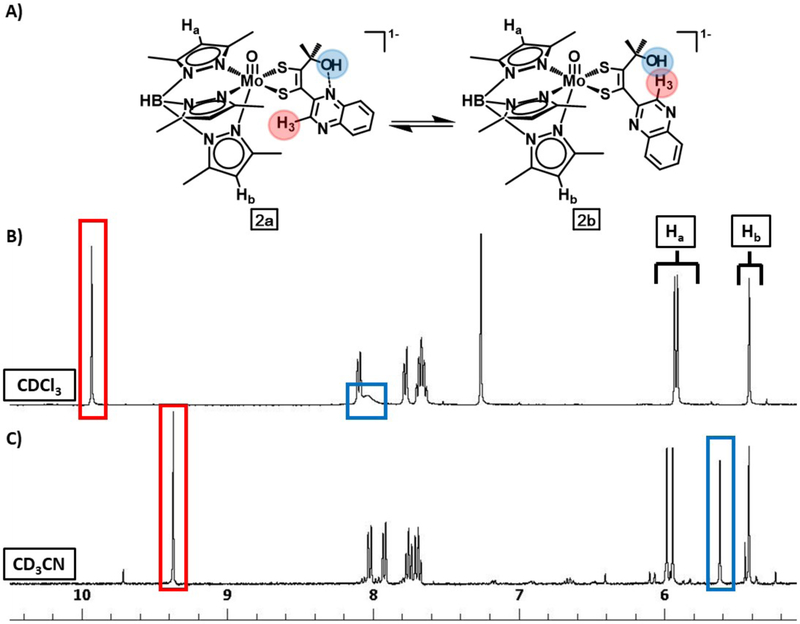
Figure 7.
1H NMR of 2 in (B) CDCl3 and in (C) CD3CN showing the solvent dependent –OH resonance (blue) due to hydrogen bonding of the hydroxyl group illustrated in (A). Resonances for Ha and Hb from Tp* are denoted accordingly, and the resonance from H3 of the quinoxaline is highlighted in red. H3 also shifts due to the changing local environment upon hydrogen bonding of the hydroxyl.

