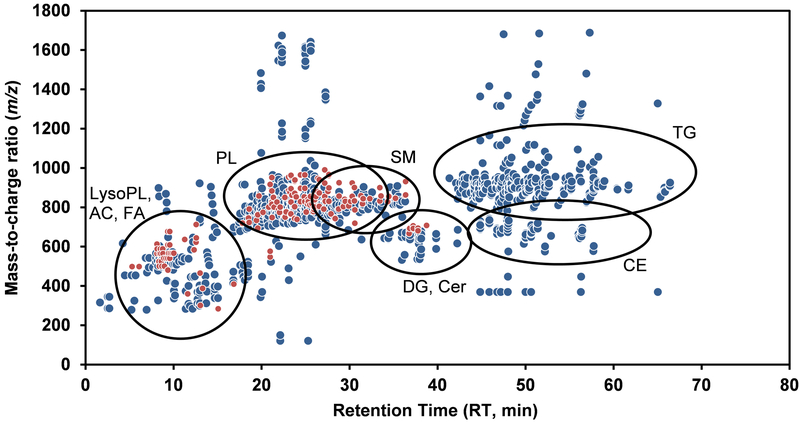
Figure 1. Representative two-dimensional map (m/z vs. retention time (RT)) of extracted MS signals or features obtained in a human plasma sample processed through our workflow.
This figure shows the 1089 features (defined by mass-to-charge ratio (m/z), signal intensity and RT; depicted as circles) acquired under our LC-MS conditions in positive (blue) and negative (red) ionization mode. The main (sub)classes of lipids detected as well as their elution time period are highlighted. Details about the identified lipids are provided in Table 1 and in the Supplemental Excel file. AC: Acylcarnitine, CE: steryl esters, Cer: ceramides, DG: diacylglycerols, FA: fatty acyls, LysoPL: lysophospholipids, PL: glycerophospholipids, SM: sphingomyelins and TG: triacylglycerols.

