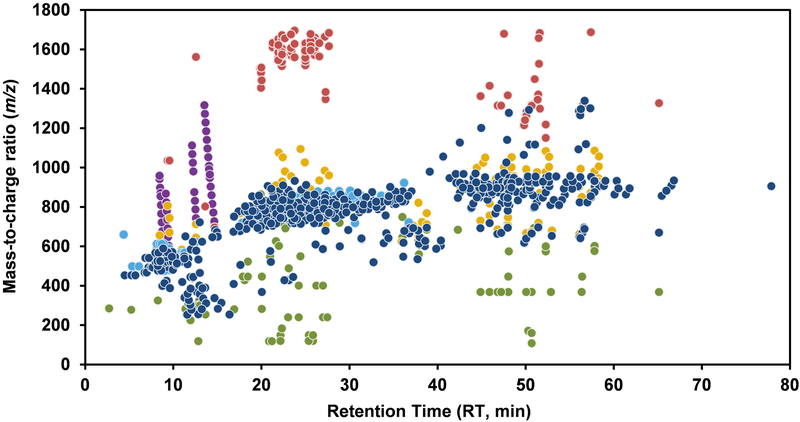
Figure 2. Two-dimensional maps depicting the different sources of MS signals.
This figure shows the 1,124 features (shown as filled circles of different colours) detected in 80% of 48 replicates of human samples using our LC-MS conditions. The figure highlights in blue 580 features identified as unique lipids and 544 other features classified as follows: contaminants (46 features, purple), dimers (102 features, red), in-source fragmentation (95 features, green), adducts not filtered out by selecting known adducts with our data processing pipeline, (151 features, yellow) and duplicates in positive and negative mode (150 features, turquoise).

