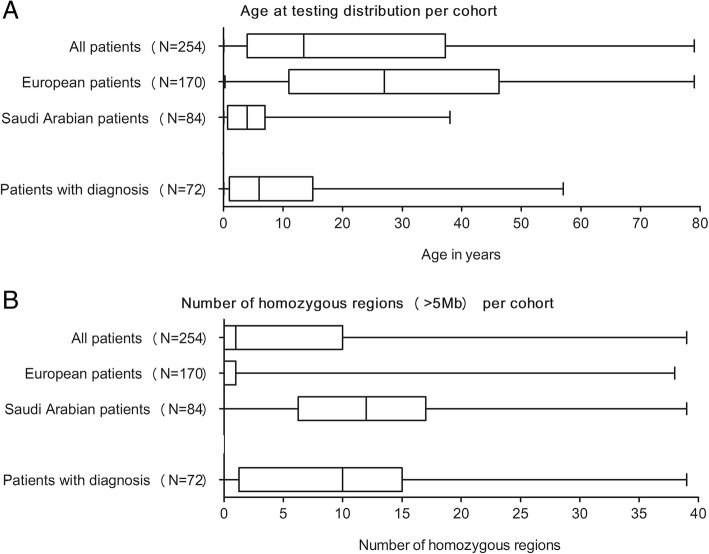
Fig. 4.
Differences in percentage diagnostic yield based on age and homozygous regions. a The age distribution of the entire cohort, the European cohort, the Saudi Arabian cohort, and the cases with a genetic diagnosis. b The number of large (> 5 Mb) homozygous regions per cohort. The increased number of homozygous regions in the Saudi Arabian cohort influenced diagnostic yield of the overall cohort

