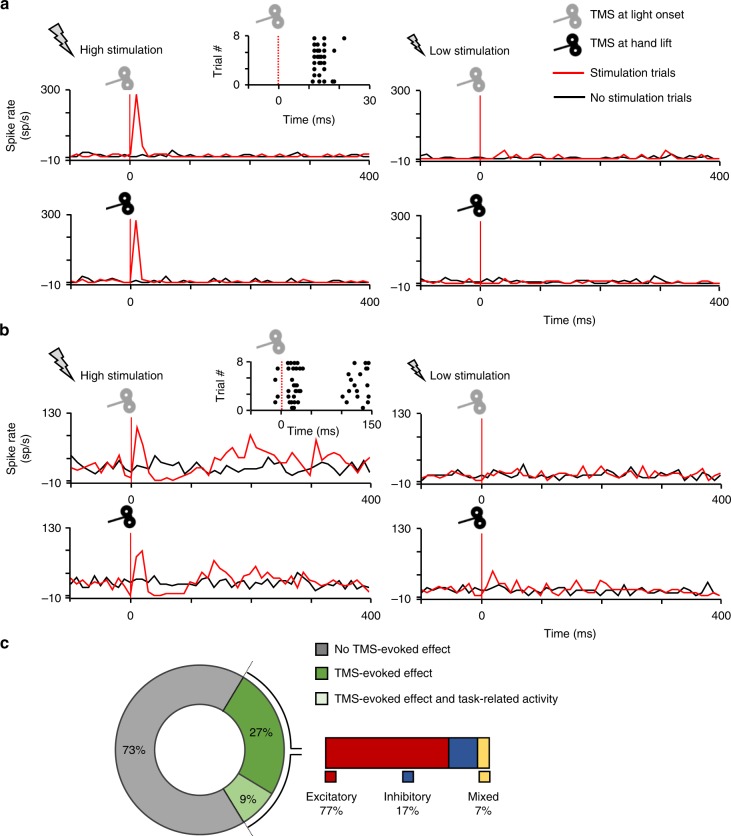
Fig. 2.
Combined single-pulse TMS and extracellular recordings in parietal area PFG. a Example neuron exhibiting a short-lasting excitatory response to high TMS stimulation (120% rMT; left panel) compared to low stimulation (60% of rMT; right panel). Stimulation (red line plots) and no stimulation trials (black line plots) were randomly interleaved during the task. In a vast majority of PFG neurons, single-pulse TMS evoked a short-lasting burst of activity, which emerged around 20 ms after stimulation, and lasted for approximately 40 ms. The induced excitation did not depend on the time of the stimulation, reaching similar amplitudes when the pulse was applied at ‘light’ onset (gray coil: visual epoch of the VGG task) or at ‘hand lift’ (black coil: reaching epoch of the VGG task). A detailed, trial-by-trial, illustration of the excitatory effect is shown in the raster plot. b Second example neuron exhibiting a combined excitatory-inhibitory pattern of TMS-evoked activity in response to high (left panel) but not low stimulation (right panel). After an initial excitatory response, we observed a longer-lasting neuromodulation phase combining both inhibitory and excitatory periods for at least 300 ms. Similarly to A, the TMS-induced excitation did not depend on whether TMS was applied during the visual (gray coil) or reaching (black coil) epoch of the task. c: Proportion of PFG recorded neurons with no TMS-evoked effect (gray), TMS-evoked effects (green) and both TMS-evoked and task-related neural responses (light green). The inset on the right shows that amongst cells with TMS-evoked effects, we predominantly found excitatory (red), and few inhibitory (blue) or mixed (yellow) TMS-induced neural responses

