Fig. 3.
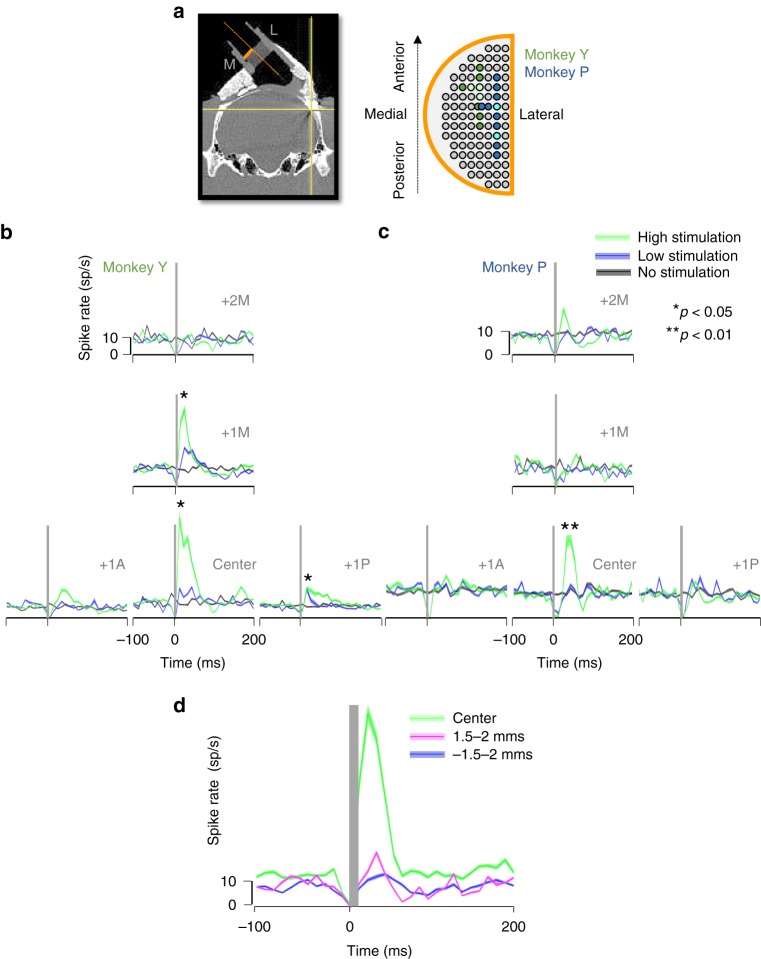
Spatial spread of the TMS-evoked activity. a Diagram of the recording grid (orange) used during the experiments. Colored electrode positions in the grid (green: monkey Y; blue: monkey P) indicate the extent of the area mapped in each animal. Brighter color shadings indicates grid points with significant TMS-evoked effects (i.e., hotspots). b, c Average spike rate obtained for all neurons recorded per grid position in response to high stimulation (green: 120% rMT), low stimulation (blue; 60% rMT) and no stimulation (black), when TMS was applied at ‘light’ onset. Graphs are arranged in a T-shape fashion in order to represent the activity maps spatially for grid positions located immediately under the center of the TMS coil (area mapped: from center to ± 1 mm antero-posterior and + 2 mm medial). Asterisks indicate statistical strength (two-sided Wilcoxon ranksum test; *p ≤ 0.05; **p ≤ 0.01). B, Monkey Y and C, Monkey P. For this and the next panel, shading indicates ± the standard error. d Analysis of the spatial spread along the electrode penetration axis (dorso-ventrally and medio-laterally oriented). The CT scan (A, left panel) illustrates the trajectory of the electrode (orange dotted line). The line plots show the average spike rate observed for all neurons recorded at the same central grid position (aligned to the center of the coil) but at different electrode depths (green: 0 depth or center of stimulation; blue: 1.5–2 mms dorsal to the center of stimulation; magenta: 1.5–2 mms ventral to the center of stimulation) in response to high TMS stimulation (120% rMT). All averaged data were obtained for the TMS applied at ‘light’ onset

