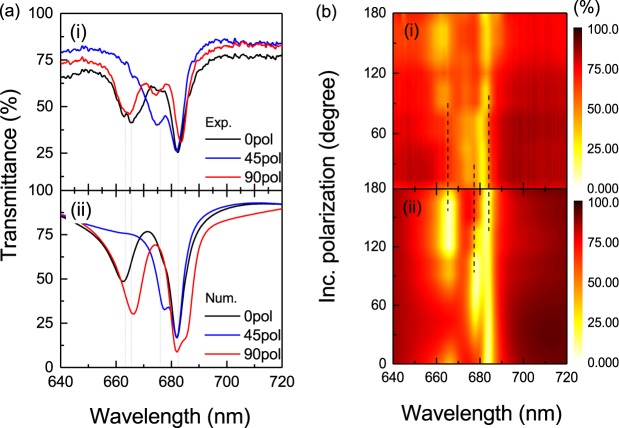
Figure 4.
(a) Comparison of transmittance spectra after LC infiltration between (i) experimental and (ii) calculated results with φ = 30° LC initial alignment rotation for the parallel model for the incident polarization parallel to φ = 0° (black curve), φ = 45° (blue curve) and φ = 90° (red curve); (b) The same comparison of (i) experimental and (ii) calculated results shown in 2D map for incident polarizations varied from 0 to 180°. The dash line marks the resonance positions.

