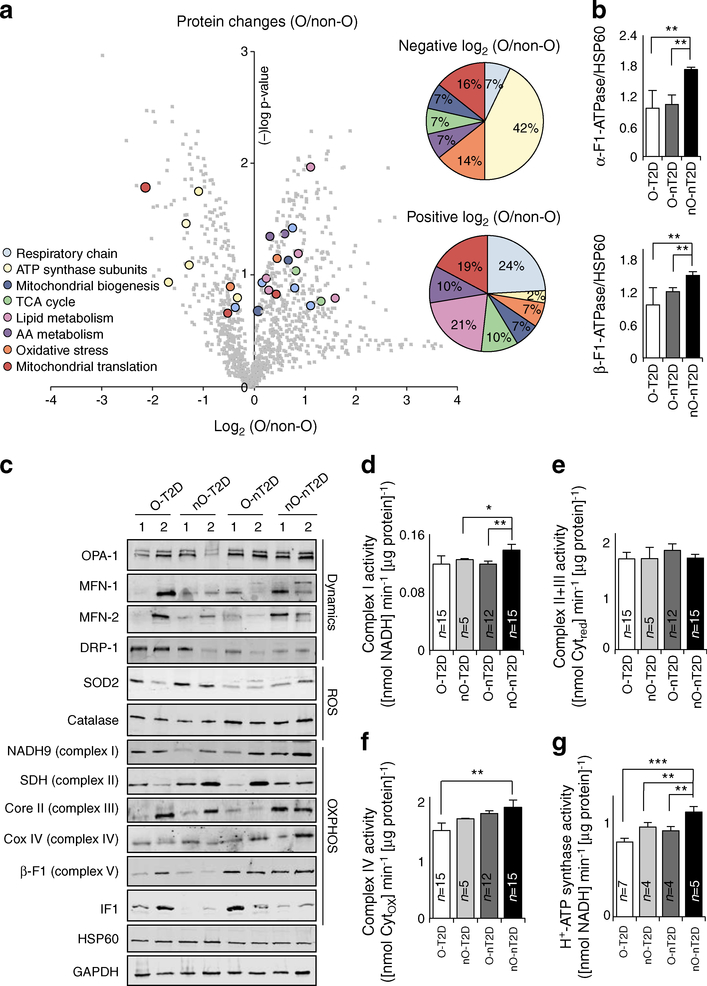
Fig. 1.
Skeletal muscle ‘mitochondrial signatures’ in pathology. (a) Proteomic analysis of mitochondria-enriched hSMCs. Lateral pie charts represent the percentage of mitochondrial downregulated (negative log2[O/non-O]) and upregulated (positive log2[O/non-O]) proteins. A (−)log p value of >1.3 was considered to be statistically significant. (b) Immunoblotting of hSMCs showing catalytic subunits α- and β-F1-ATPase of H+-ATP synthase. (c) Representative blots of mitochondrial proteins related to dynamics, ROS signalling and OXPHOS, and quantification of ETC complex activities (d–f) in 100 skeletal muscle biopsies. (g) H+-ATP synthase activity in isolated mitochondria from hSMCs. AA, amino acid; Core II, ubiquinol-cytochrome c reductase core protein II; COX IV, mitochondrially encoded cytochrome c oxidase IV; MFN-1, mitofusin 1; MFN-2, mitofusin 2; SDH, succinate dehydrogenase complex; TCA, tricarboxylic acid. Histograms show the mean ± SEM of the number of individuals analysed. *p < 0.05, **p < 0.01, ***p < 0.001 by ANOVA multiple comparisons. Non-O, non-obese; O, obese. Also see ESM Figs 1–3 and Tables 1, 2

