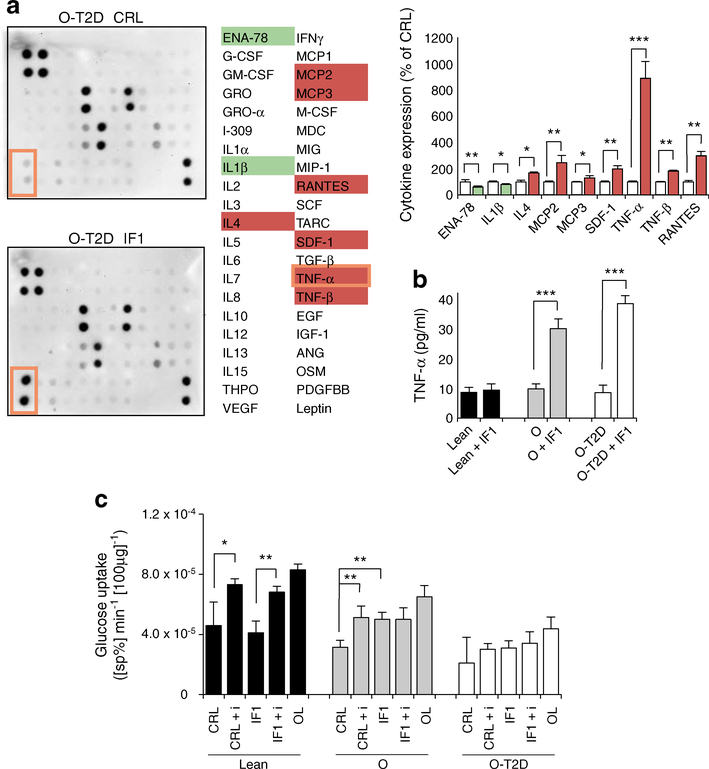
Fig. 4.
IF1 regulates myokine release and insulin sensitivity. (a) Comparison between secretomes of control (CRL, white bars) and IF1-overexpressing (IF1, coloured bars) myotubes from O-T2D participants. See ESM Fig. 6 for the array map and total myokine expression. Protein expression scores: red, high; white, normal; green, low; orange border shows TNF-α. Bars are mean ± SEM of three independent experiments. Quantification (pg/ml) of TNF-α levels (b) and rates of glucose uptake (c) in hSMCs. The effects of oligomycin (OL; 5 μmol/l), insulin (+ i, 100 nmol/l) and IF1 are shown. (b, c) Black bars, healthy individuals; grey bars, obese individuals; white bars, obese diabetic individuals. Bars show mean ± SEM for hSMCs from three healthy, four obese and ten obese diabetic individuals. *p < 0.05, **p < 0.01, ***p < 0.001 by ANOVA multiple comparisons. ANG, angiogenin; ENA-78, epithelial-derived neutrophil-activating peptide 78; G-CSF, granulocyte colony stimulating factor; GM-CSF, granulocyte–macrophage colony stimulating factor; GRO, growth-regulated protein; GROα, growth-regulated protein α; MCP, monocyte chemotactic protein; M-CSF, macrophage colony stimulating factor; MDC, macrophage-derived chemokine; MIG, monokine induced by γ interferon; MIP, macrophage inflammatory protein; OSM, oncostatin M; PDGFBB, platelet-derived growth factor-BB; RANTES, regulated on activation, normal T cell expressed and secreted; SCF, skp, cullin, F-box containing complex; SDF, stromal cell-derived factor; sp%, specific percentage; TARC, thymus and activation regulated chemokine; THPO, thrombopoietin; VEGF, vascular endothelial growth factor

