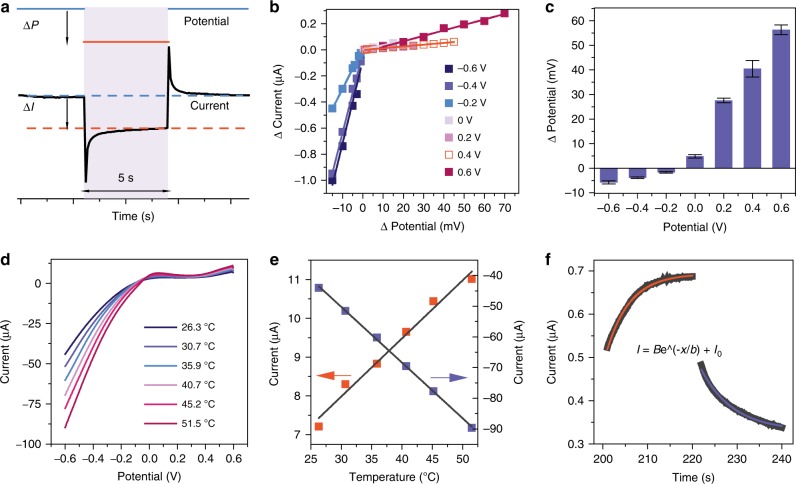
Fig. 3.
The potential-step and temperature-control experiments. a The typical i−t curve in response to a potential step, ΔI is the current change induced by the step potential (ΔP) after a 5 s interval to stabilize. b The change of current as a function of the step potential at various applied potentials. c Step potential required to achieve a similar current change as was achieved with the RRC at various applied potentials. d The I–V curve of the Au nanoelectrode array at various temperature. e The current at −0.6 V (blue) or 0.6 V (red) as the function of the temperature. f The fitting of the SRC at 0.6 V, the black dots are the experimental result (0.6 V 200–240 s); the red lines are the fitted functions under illumination; the blue line are the fitted functions in the dark. The error bars represent the standard deviation

