Fig. 1.
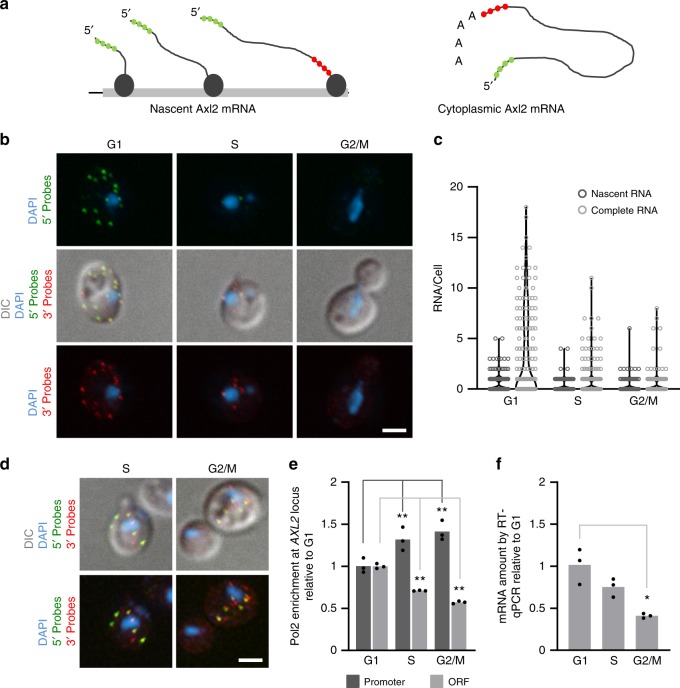
Single mRNA molecules analysis reveals synthesis of Axl2 mRNA across the cell cycle. a Schematic representation of the probes used to detect AXL2 mRNA in the fluorescence in situ hybridization (FISH) assay shown in (b). Probes complementary to the 5′ end of the target are shown in green and those to the 3′ end are red. b Monitoring AXL2 expression through the cell cycle using single cell FISH assay. The RNA was detected using the probes illustrated in (a) and the nuclei stained with DAPI (blue). The cell cycle phases were determined using the bud size and nucleus position. The white bar equals 2 µm. c AXL2 expression is downregulated during S and G2/M. Nascent mRNAs (dark gray) are defined as RNAs detected using the 5′ probe in the nucleus, while complete cytoplasmic mRNAs (light gray) are detected by both 5′ and 3′ probes in the cytoplasm. The number of RNAs per cell is shown in the violin plot for 150 cells analyzed per phase. d Examples of cells transcribing Axl2 mRNA in the S and G2/M. RNA was detected as described in (b). e Cells were synchronized in G1, S, or G2/M and the enrichment of RNAPII at the AXL2 locus was analyzed by ChIP and normalized to the G1 enrichment. f The amount of Axl2 mRNA from the synchronized cultures used in (e) was determined using qRT-PCR and presented relative to the amount detected in G1. The bar graphs represent the average of 3 independent biological replicates and the value of each replicate is shown as dot. (*p < 0.05 and **p < 0.01 by two-tailed paired t test)

