Fig. 1.
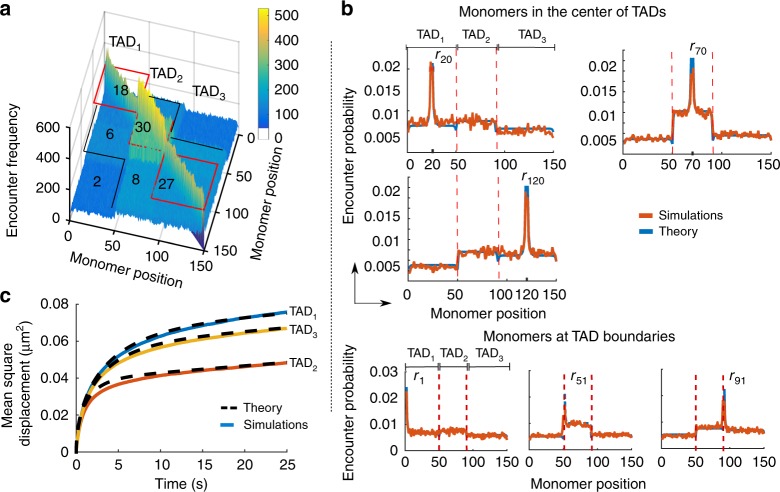
Statistical properties of the heterogeneous RCL polymer. a Encounter frequency matrix of a polymer with three TAD blocks (TAD1, TAD2, TAD3) of N1 = 50, N2 = 40, N3 = 60 monomers, computed from 10,000 simulations of Eq. (17) with Δt = 0.01 s, D = 8 × 10⁻³ μm2/s, d = 3, b = 0.2 μm1. The number of added connectors appears in each block. Three distinct diagonal TADs are visible (red boxes) where secondary structure appears (black lines) due to weak inter-TAD connectivity. b Encounter probability (EP) of the heterogeneous RCL described in panel (a), where the simulated (orange) and theoretical (blue, Eqs. (3) and (5)) EP agree. In the upper panel, we plotted the EP for middle monomers in each TAD: monomer r20 (upper left), monomer r70 (top right), and monomer r120 (bottom left). In the bottom panel, we plotted the simulated (orange) vs. theoretical EPs (blue) for monomers r1 (left), r51 (center), and r91 (right), located at TAD boundaries. c Average mean-square displacement of monomers in each TAD of the heterogeneous RCL polymer, simulated as described in panel (a), simulations (continuous) vs. theory (dashed, Eq. (7)) until t = 25 s

