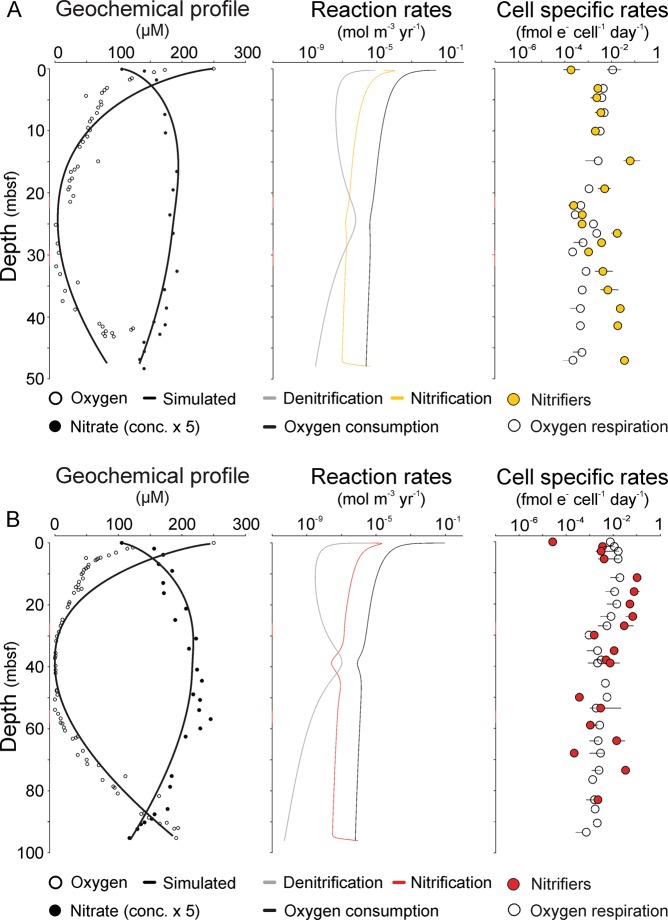
Figure 1.
Geochemical profiles and reaction rates. Sediment core 3E (A) and 4A (B) displays Left to Right: (1) Nitrate and oxygen profiles. circles represent observed concentrations and solid lines simulated model output. Note that nitrate concentrations are upscaled with a factor five relative to true values. (2) Calculated reaction rates for nitrification (yellow and red lines in 3E and 4A, respectively), denitrification (grey lines) and oxygen consumption (black stipulated lines). (3) Cell specific reaction rates estimated from bulk volumetric reaction rates divided by functional gene abundances for nitrification (yellow and red circles in 3E and 4A, respectively) and bulk oxygen respiration (open circles). Error bars indicate standard deviation from qPCR quantification of functional genes.

