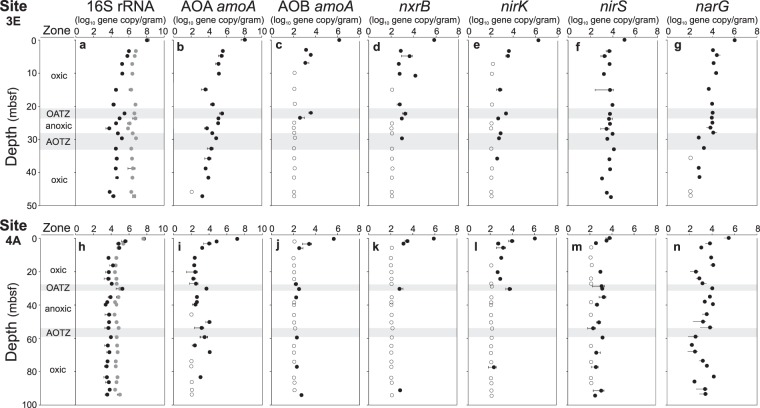
Figure 2.
Functional gene abundances. Quantified gene copy numbers by qPCR in sediment cores 3E (panel a–g) and 4A (panel h–n). Left to Right: Oxygen regime, 16S rRNA (Archaea black circles and Bacteria grey circles), archaeal amoA, bacterial amoA, nxrB, nirK, nirS and narG. Open circles indicate abundances at or below detection limit (102 copies g-1 sediment). The oxic/anoxic transition zones (OATZ) and the anoxic/oxic transition zones (AOTZ) are marked with grey-shaded area.

