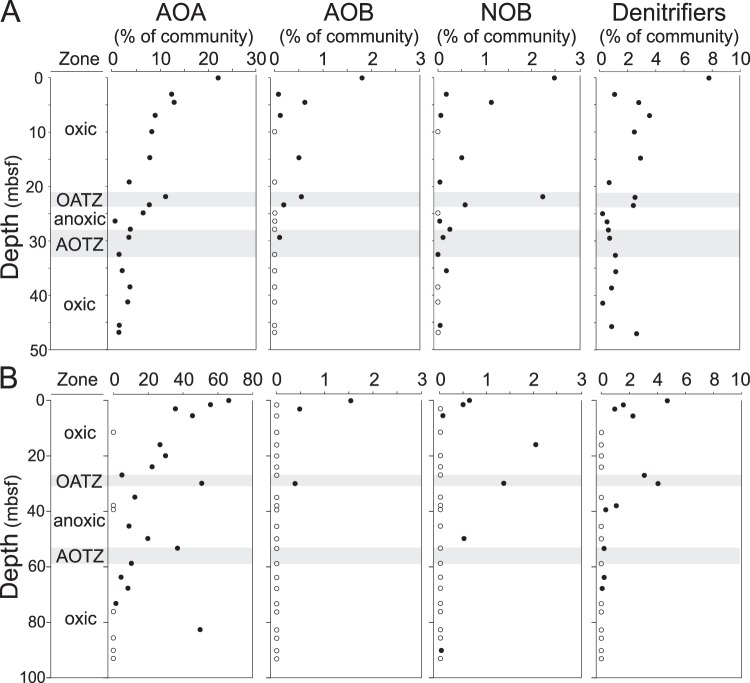
Figure 3.
Functional group abundances. Values are based on taxonomic affiliation of partial 16S rRNA genes in core 3E (A) and 4A (B) and given as percent relative abundances of the total community population. Left to Right: Oxygen characteristics, putative ammonium oxidizing archaea (AOA), ammonium oxidizing bacteria [AOB], nitrite oxidizing bacteria (NOB) and denitrifiers (see material and methods for taxa included in each functional group). The oxic/anoxic transition zones (OATZ) and the anoxic/oxic transition zones (AOTZ) are marked with grey shaded area. Note the difference in range of x-axis values of AOA between the two cores.

