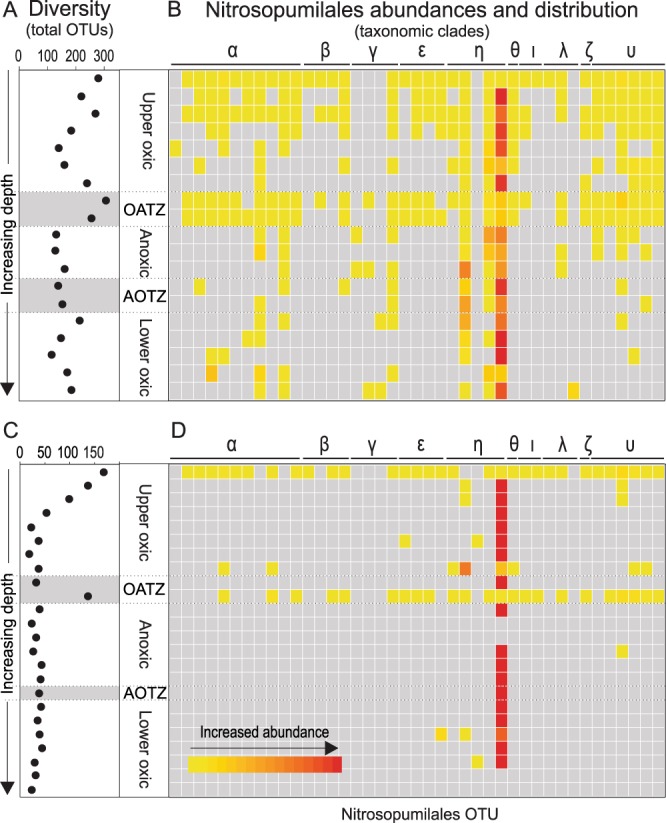
Figure 4.

Microbial diversity and distribution of nitrifiers. Microbial richness as a function of depth measured by OTU abundance in core 3E (A) and 4A (C). The oxic/anoxic (OATZ) and the anoxic/oxic (AOTZ) transition zones are marked with grey. Heatmap of the relative abundances of different Nitrosopumilales species (OTUs) is represented by each individual column in core 3E (B) and 4A (D). Distinct phylogenetic clusters are marked with Greek letters.
