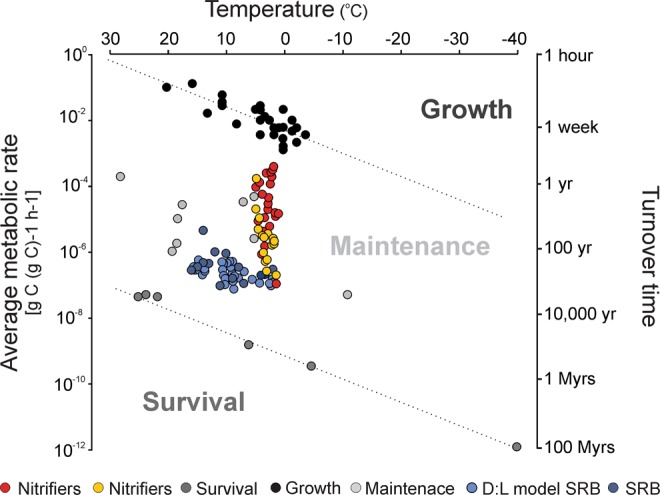
Figure 5.

Mean metabolic rates and turnover times. Mean metabolic rates (left y-axis), converted from cell-specific rates, plotted against inferred temperature to identify the metabolic status. Turnover time of cellular carbon (right y-axis) as a function of temperature adopted from Price and Sowers (2004). Nitrifiers in core 4A (red) and 3E (yellow). Literature values from marine subsurface sulfate reducers are obtained from ref.57 (dark blue) and the D:L razemization model values from ref.54 (light blue). Metabolic rates needed for survival (grey circles), maintenance (light grey circles) and growth (black circles) are obtained from Price and Sowers (2004).
