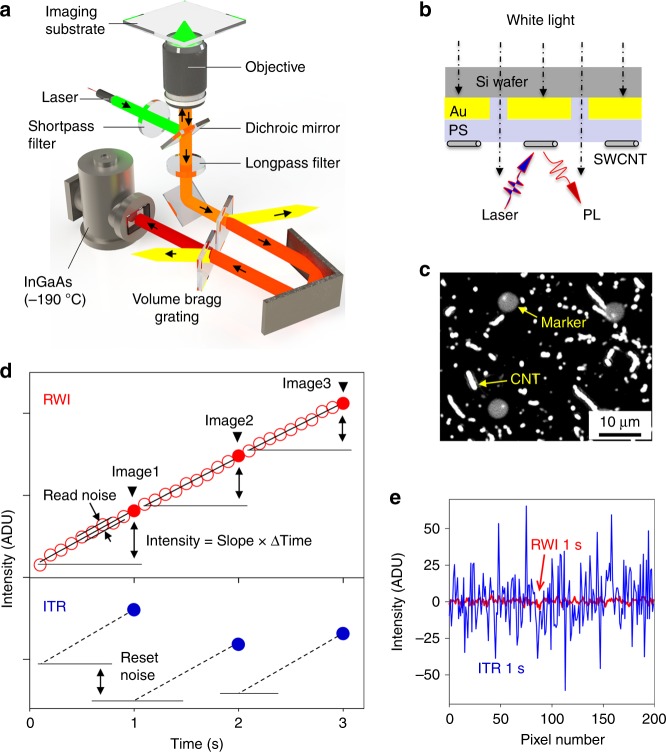
Fig. 2.
Single-defect spectroscopy set-up. a Schematic of the system, which integrates a volume Bragg grating for hyperspectral imaging and an InGaAs 2D array detector that operates at −190 °C to significantly suppress the dark current in the shortwave IR. b Schematic of the imaging substrate that incorporates Au-on-Si markers and polystyrene (PS) insulating layer for drift correction in the shortwave IR. c A PL image with both SWCNTs and the markers simultaneously resolved. Note that nanotubes with length smaller than the diffraction limit (~600 nm for a numerical aperture 0.85 objective collecting emission at 1000 nm) appear as white dots in the image. d The comparison of signals of the same pixel from an image sequence captured by the integrate-then-read (ITR, blue filled circles) and read-while-integrate (RWI, red empty circles) demonstrates the working principle of non-destructive RWI mode. The integration slopes for different images in ITR (dashed lines) do not have identical starting point, caused by reset noise. Unlike ITR, RWI does not reset the detector, thus eliminating the reset noise. For each image (red filled circles) in RWI, the noise can be further suppressed by linear regression of different data points to retrieve the integration slope (black solid line). e The comparison of background signals from images captured by the ITR (blue) and RWI (red). Under otherwise identical conditions, RWI demonstrates more than an order of magnitude lower noise level than ITR, with a standard deviation of merely 1.75 analog-digital unit (ADU) (vs. 18.5 ADU for ITR). Note that 0.168 ADU corresponds to one photon arriving at the detector

