Fig. 3.
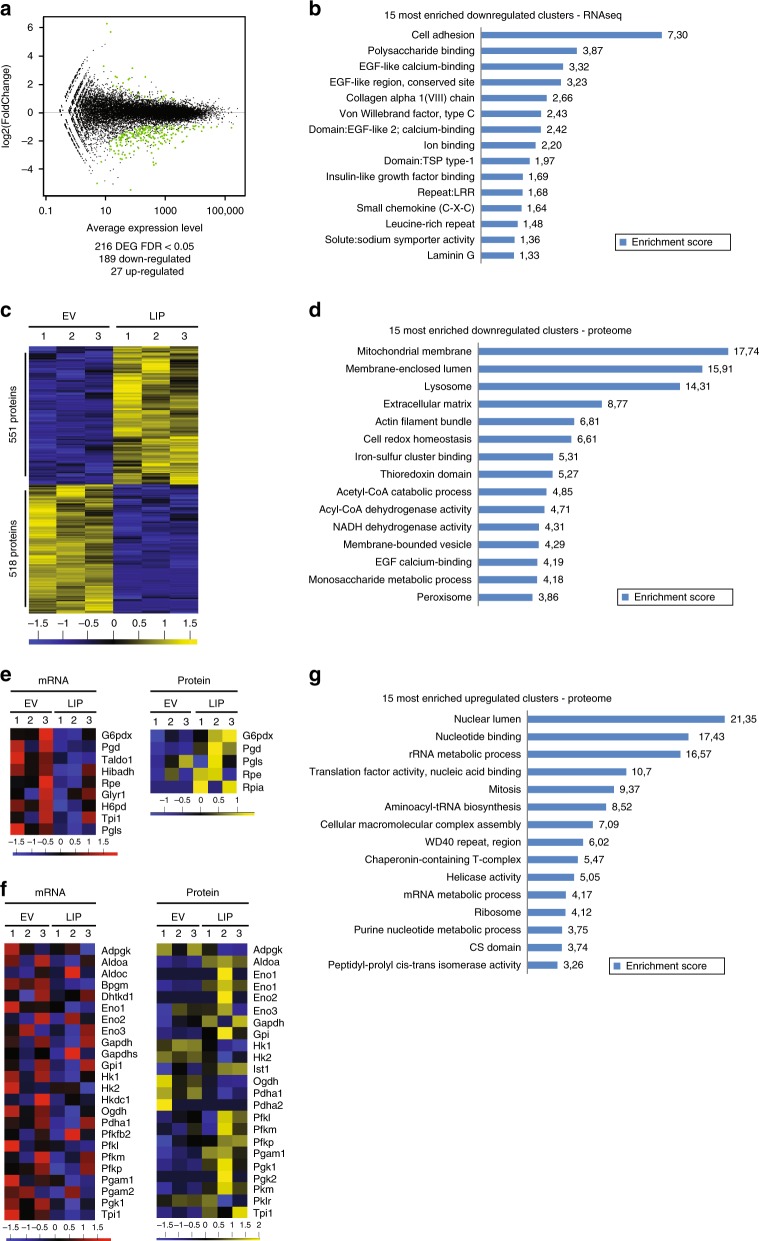
LIP differentially regulates transcriptome and proteome. a Differentially expressed genes (DEG) by ectopic expression of LIP in Cebpb-ko MEFs compared to control empty vector (EV) with an FDR < 0.05. b 15 most enriched functional clusters (DAVID) of mRNAs downregulated in LIP expressing Cebpb-ko MEFs. c Heat map representation of calculated z-scores for differentially expressed proteins in response to LIP expression in Cebpb-ko MEFs compared to EV control. d 15 most enriched functional clusters (DAVID) of proteins downregulated in LIP expressing Cebpb-ko MEFs. e Heat map representation of calculated z-scores for mRNAs and proteins of the pentose-phosphate-shuttle pathway. f Heat map representation of calculated z-scores for mRNAs and proteins of the glycolysis pathway. g 15 most enriched functional clusters (DAVID) of proteins upregulated in LIP expressing Cebpb-ko MEFs. For panels c, e and f z-scores as the number of standard deviations from the mean are depicted below the heat maps; increased colour intensity (+red/-green for mRNA and +yellow/-blue for protein) represents expression levels that are higher or lower than the mean levels from both conditions relative to the standard deviation associated by the mean

