Fig. 6.
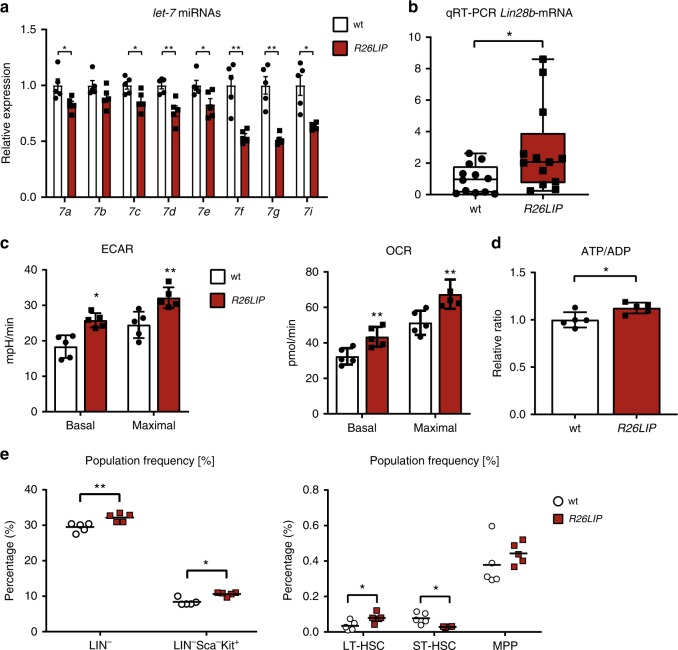
LIP regulates let-7/Lin28b in the bone marrow. a Expression levels of let-7a, b, c, d, e, f, g and i in bone marrow of R26LIP mice compared to wt mice (n = 5). b Expression level of Lin28b-mRNA by qRT-PCR in bone marrow of R26LIP mice compared to wt mice (n = 13). c ECAR and OCR of bone marrow cells of R26LIP mice compared to wt mice (n = 5). d Relative ATP/ADP ratio in bone marrow cells of R26LIP mice compared to wt mice (n = 5). e Population percentages of LIN− and LIN−Sca+Kit+ cells, or LT-HSCs, ST-HSCs and MPPs in the bone marrow of R26LIP LIP-overexpressing mice compared to wt control mice (n = 5). Statistical differences were analysed by Student’s t-tests. Error bars represent +SD, *P < 0.05, **P < 0.01

