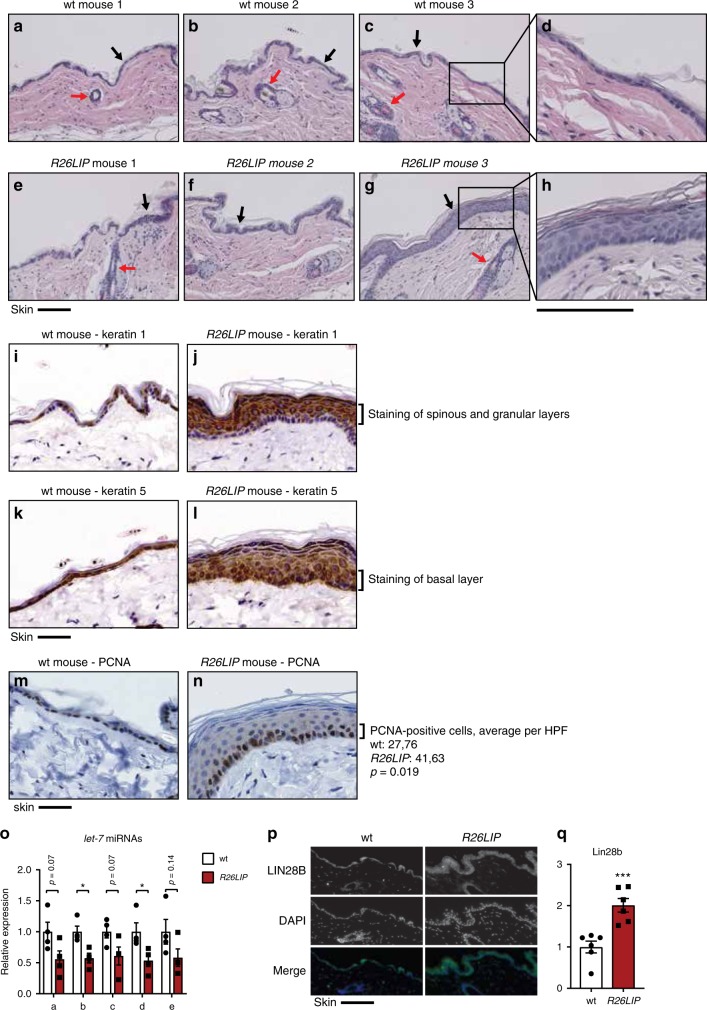
Fig. 7.
LIP regulates let-7/Lin28b in the epidermis. a–d Bright-field microscopy images of haematoxylin and eosin (HE) stained skin sections of wt (a–d) and R26LIP (e–h) mice. Black arrows point to epidermis; red arrows to hair follicles. Scale bars represent 100 μm. Bright-field microscopy images of Keratin 1 immunohistochemical staining of skin sections of wt (i) and R26LIP (j) mice, and of Keratin 5 staining of skin sections of wt (k) and R26LIP (l) mice. Scale bars represent 50 μm. Bright-field microscopy images of PCNA immunohistochemical staining of skin sections of wt (m) and R26LIP (n) mice, with quantification at the right (n = 5 for wt and n = 6 for R26LIP, 5 HPF per mouse). o Expression levels of let-7a, b, c, d and e in the skin of R26LIP mice compared to wt mice (n = 4). p LIN28B specific immunofluorescence microscopy images of skin sections of a R26LIP mice and wt mice. Scale bar 100 μm. q The bar graph shows quantification of LIN28B-staining (n = 6). Statistical differences were analysed by Student’s t-tests. Error bars represent SD, *P < 0.05, **P < 0.01, ***P < 0. 001

