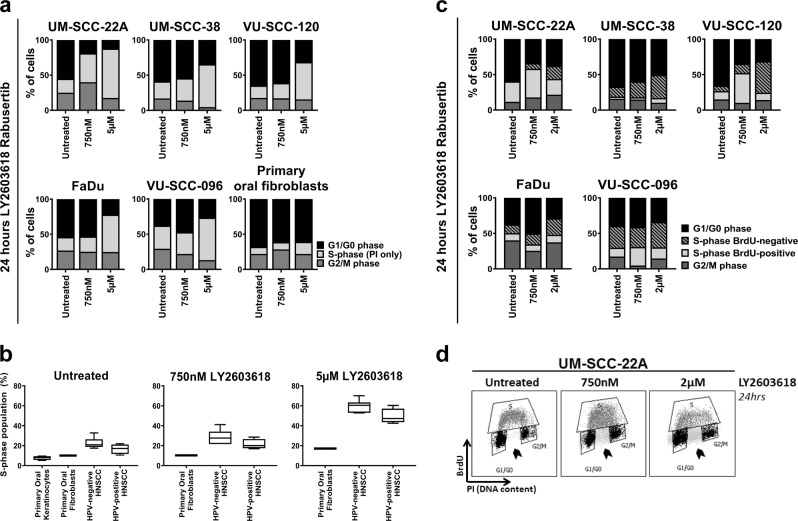
Fig. 3. Chk1 inhibition results in an increasing S-phase population due to replication problems.
a A general cell cycle distribution was obtained after 24 h of LY2603618/Rabusertib treatment of HNSCC cell lines and primary oral fibroblasts. After RNAse incubation, the DNA content was stained with propidium iodide (PI). For all cell lines, an increased S-phase population was observed. Relative DNA content is depicted. An extended panel of HNSCC cell cycle profiles upon LY2603618/Rabusertib treatment is depicted in Fig. S3f. b Mean S-phase population determined by PI FACS analysis of primary oral fibroblasts, HPV-negative HNSCC cell lines, and HPV-positive HNSCC cell lines. S-phase population of untreated primary oral keratinocytes were obtained from previously published data21. Untreated and LY2603618/Rabusertib treated populations are shown. All HNSCC cell lines, except UM-SCC-47, contained a higher S-phase population compared with the primary mucosal cells. Upon treatment, the S-phase population of the HNSCC cells increases drastically, where the primary fibroblast S-phase population remains small (untreated 10%; 750 nM 10.2%; 5 µM 17.1%). Generally, HPV-negative cell lines showed the largest S-phase population, in all conditions tested, suggesting severe replication stress. c Cell cycle analysis of DNA replication by BrdU and DNA content by PI. The total S-phase population is represented in two populations; BrdU-positive and BrdU-negative. Striking is the increasing population of non-replicating cells, that did proceed from G1 to S-phase, but were not able to incorporate BrdU during the pulse. These non-replicating cells in untreated cells represent baseline replication stress, which is enhanced by Chk1 inhibition in all cell lines. d Representable gating example of FACS analysis. Arrow heads depict the non-replicating cells in S-phase that are negative for BrdU. The lower graphs show the gated event graphs of the G1/G0, S (BrdU-positive cells only) and G2/M populations from upper squatter plots

