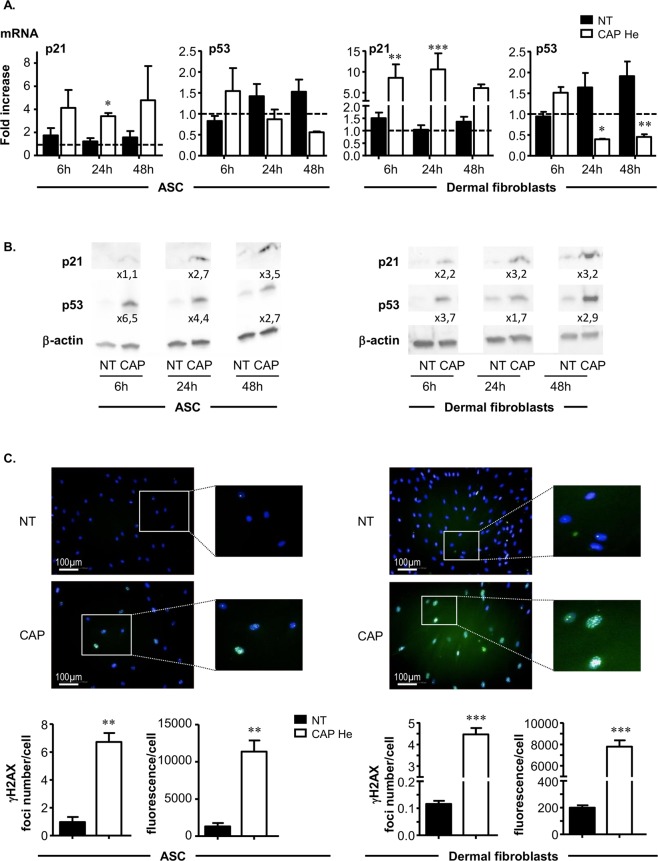
Figure 3.
CAP He treatment is associated with an increase in p21 p53 and DNA damage. (A) ASC and dermal fibroblasts were treated (CAP or NT) and p21 and p53 mRNA expression was quantified by RT-qPCR at indicated times. Results are presented in fold increase relative to their basal expression at day 0 (dot line). (B) p21 and p53 protein level in treated cells was assessed by Western-blot. Quantification corresponds to the fold increase in band intensity of CAP-treated cells normalized to corresponding untreated cells (NT) and divided by β-actin signal. (ASC, n = 3 to 7; fibroblasts, n = 4 to 9). (C) Cells were treated and fixed 7 days after treatment to evaluate DNA damage foci by γ-H2AX immunofluorescence. Images were acquired using the high content imaging system Operetta (Perkin Elmer, lens x20) to quantify immunofluorescence and foci number (n = 3). Data represent mean ± SEM of independent experiments as indicated (n).

