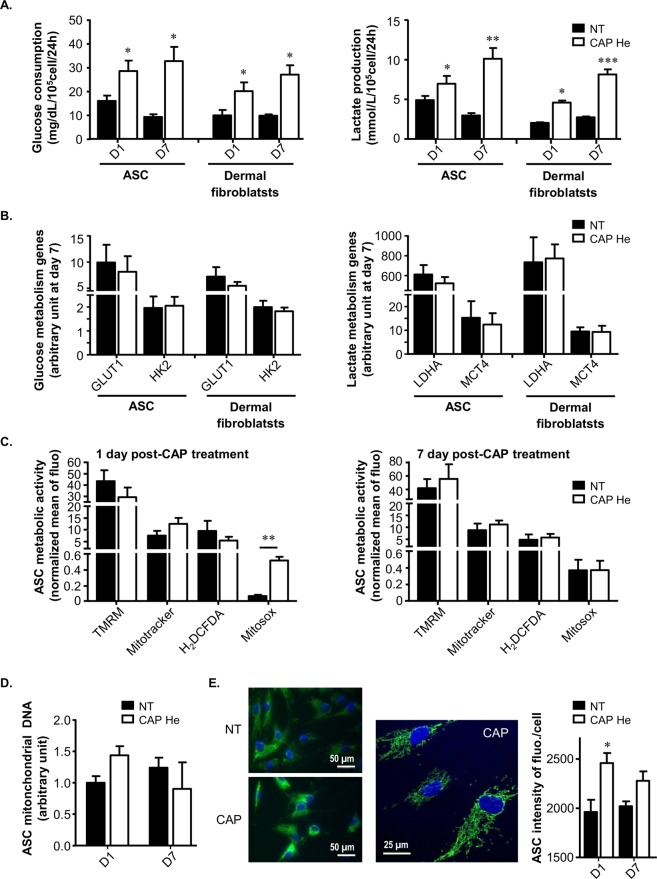
Figure 5.
The senescent phenotype is associated with a switch to a glycolytic metabolism and mitochondria modifications. (A) ASC and dermal fibroblasts were treated (CAP or NT) and glucose and lactate concentrations were measured in supernatant 1 (D1) and 7 (D7) days after the treatment (n = 3 to 6). (B) The level of GLUT1, HKII, LDHA and MCT4 mRNA expression was quantified by RT-qPCR 7 days after the treatment (ASC n = 6; fibroblasts n = 3). (C) ASC were treated (CAP or NT) and tested after 1 and 7 days for their mitochondrial membrane potential using the TMRM probe, the mitochondria mass using the MitoTracker probe, intracellular ROS production using H2DCFD and mitochondrial ROS production using Mitosox probe. Quantification is represented by the Mean of Fluorescence Intensity (MFI) normalized to the same condition without labelling (n = 4). (D) ASC were treated (CAP or NT) and tested for mitochondrial DNA quantification 1 and 7 days after treatment (n = 3). (E) ASC were treated (CAP or NT) and stained by immunofluorescence for mitochondria content 1 and 7 days after treatment. Pictures were taken with a Nikon, Eclipse, TE2000-S microscope (x400 magnification) with the same calibration and a zoom was realized with a confocal LSM 780 (Zeiss) (x630 magnification). Quantification is performed using the high content imaging system Operetta (Perkin Elmer, lens x20) (n = 3). Data represent mean ± SEM of independent experiments as indicated (n).

