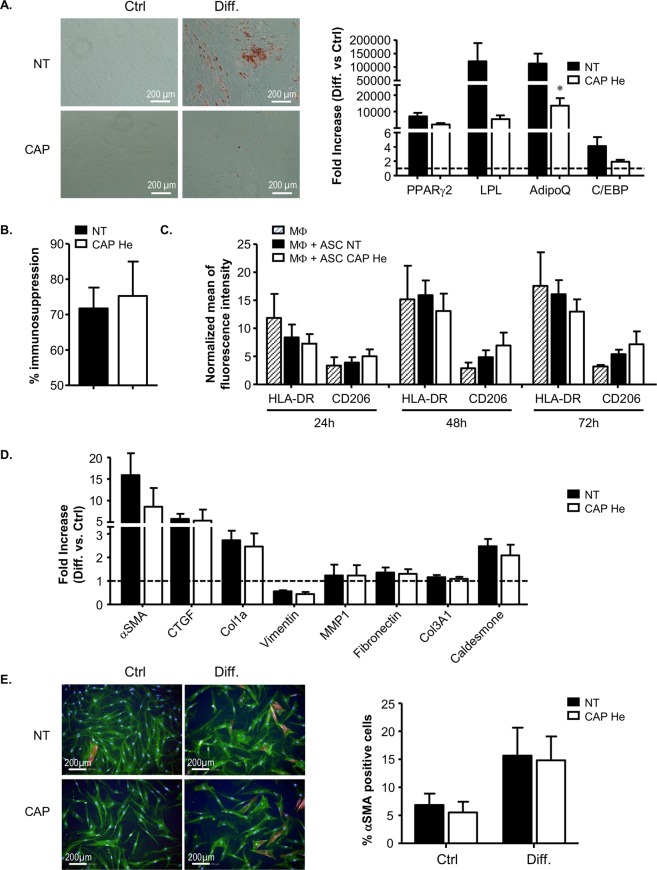
Figure 6.
Analysis of senescent ASC and dermal fibroblasts functional properties. (A) ASC adipogenic potential was assessed 7 days after ASC treatment (CAP or NT) by induction of differentiation (Diff.) and analysis by Oil-Red-O staining of lipid droplets (day 21 after induction of differentiation) and by RT-qPCR for adipogenic gene expression PPARγ2, LPL, Adiponectin and C/EBPα (day 14 after induction of differentiation) in comparison to ASC cultivated in control medium (Ctrl, no differentiation). Pictures were made with Nikon, Eclipse, TE2000-S microscope. RT-qPCR results are represented in fold increase to control medium condition (dot line) for the different genes (n = 4). (B) ASC were tested for their immunosuppression activity by co-cultivating ASC with activated T lymphocytes (TL) labelled with the CFSE marker. The percentage of immunosuppression is determined by flow cytometry after 5 days (proliferating TL = % TL CFSE negative) (n = 6). (C) Effect on macrophage polarization was performed by co-cultivating ASC with M0 macrophages (monocytes cultivated 6 days with M-CSF) and macrophage phenotype analysis by flow cytometry at indicated times for membrane markers CD45, HLA-DR and CD206. Data are represented in mean of fluorescent intensity (MFI) normalized to isotype control among living macrophages (DAPI negative and CD45 positive cells) (n = 4). (D) Dermal fibroblasts 7 days after treatment (CAP or NT) were tested for their differentiation into myofibroblast under TGF-β stimulation by RT-qPCR for αSMA, CTGF, vimentin, MMP1, fibronectin, collagen COL1a, COL3A1 and caldesmone (72 hours). Data are represented in fold increase to control media (n = 3). (E) Dermal fibroblast activation was also estimated by α-SMA labeling and imaging using the high content imaging system Operetta (Perkin Elmer, lens x20) (n = 4). Data represent mean ± SEM of independent experiments as indicated (n).

