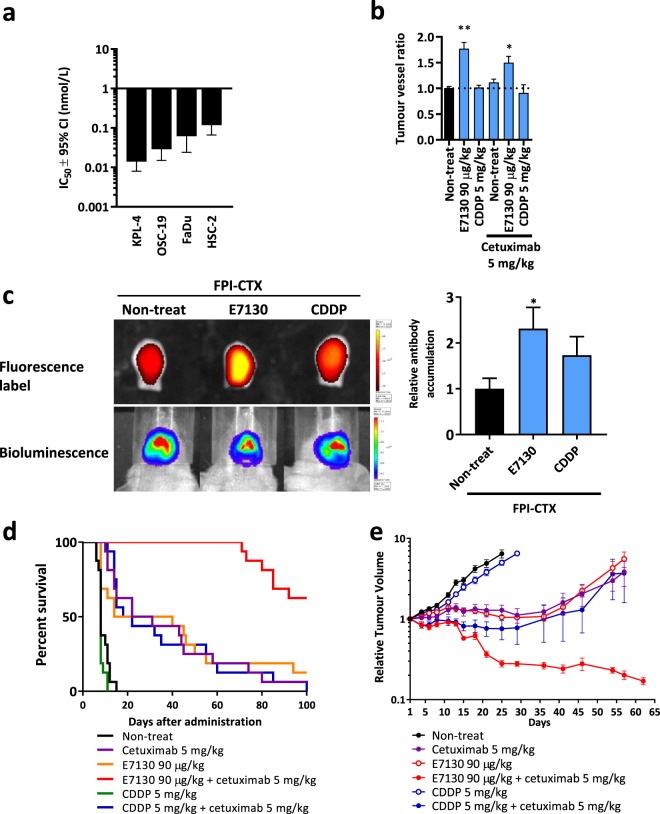
Figure 2.
Biochemical, cellular, and in vivo mechanistic activity of E7130. (a) The effect of E7130 on the viability of 4 cell lines after 3 days represented as the concentration of E7130 required to decrease cell viability to 50% (IC50) and 95% confidence interval (CI). (b) HSC-2 squamous cell carcinoma of the head and neck orthotopically transplanted tumours were collected 4 days after the administration. Data show the mean tumour vessel ratios of treated to non-treated ± s.e.m. (n = 3). *P = 0.0228, **P = 0.0030 versus non-treated (Dunnett’s multiple comparison test). (c) The accumulation of fluorescent-labelled cetuximab (FPI-CTX) was analysed using an In Vivo Imaging System (IVIS) 5 days after the indicated administration. Representative in vivo bioluminescence images and ex vivo fluorescence labelling in resected tongues are shown. The values of total flux (photon/second) were normalized with each bioluminescent value (photon/second). The graph shows the mean FPI-CTX accumulation ratios to the accumulation in the FPI-CTX mono-administration group ± s.e.m. (n = 4). *P = 0.0440 versus FPI-CTX mono-administration (Two-tailed unpaired t test). (d) Effect of the indicated administration on day 1, day 8, and day 15 on survival in the HSC-2 orthotopic transplantation mouse model (n = 16). (e) Effect of the indicated administration on day 1, day 8, and day 15 on the relative tumour volume of the subcutaneous HSC-2 subcutaneous xenograft model. In this study, nine days after the cell inoculation subcutaneously in the right flank of Balb/C-nu mice, 36 mice were selected based on their tumour volumes and shapes of tumours, and were randomly allocated into 6 groups (day 1). The mean tumour volume of mice assigned to the groups on day 1 were 321.6 mm3. The mean relative tumour volume to the tumour volume on day 1 ± s.e.m. is shown (n = 6).

