Figure 4.
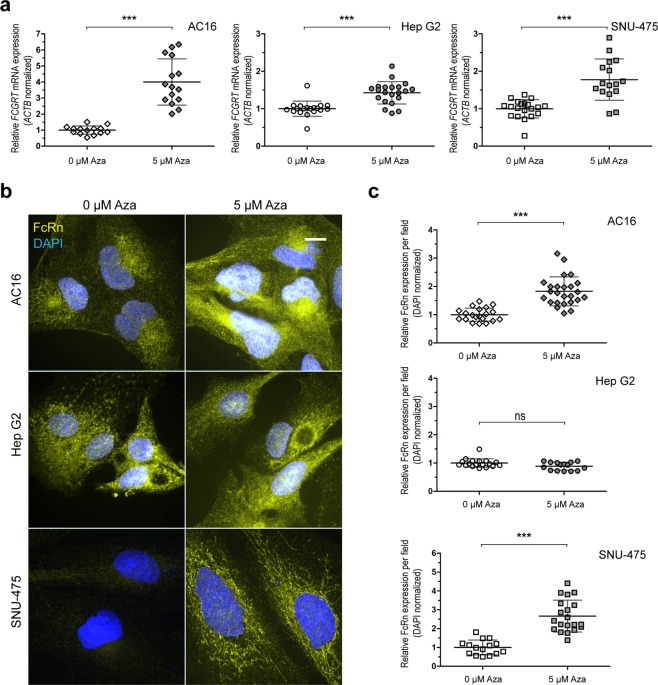
Impact of Aza treatment on FCGRT expression. (a) FCGRT mRNA expression in AC16, Hep G2, and SNU-475 cells after Aza treatment (5 µM, 72 h). Plots depict fold differences in FCGRT mRNA expression levels relative to controls (0 µM Aza). Each point represents individual measurements. Horizontal bars show the mean ± SD from three experiments performed in quintuplicates. *** P < 0.001, ns = not significant, Student’s t test. (b) Cellular FcRn protein expression (yellow) before and after Aza treatment (5 µM, 72 h. Representative images). Nuclei were stained with DAPI (blue). Scale bar: 10 µm. (c) Quantitation of FcRn relative fold expression after Aza treatments. Each point represents individual measurements. Horizontal bars show the mean ± SD from two independent experiments (8–10 fields per condition). *** P < 0.001, ns = not significant, Student’s t test.

