Fig. 1.
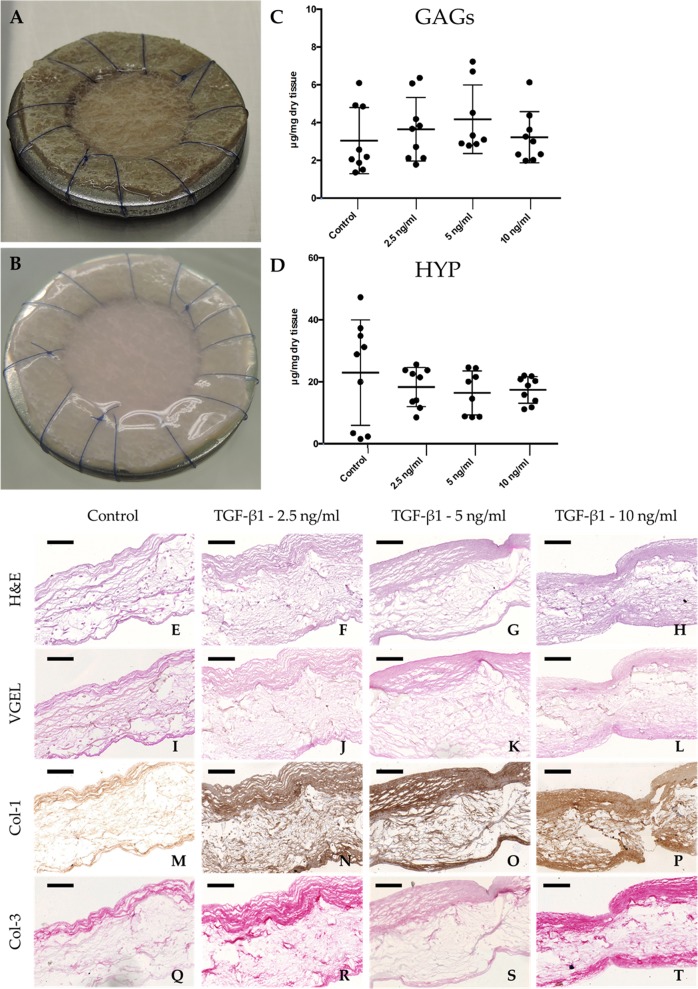
Qualitative evaluation of hTEM patches cultured with hDF and quantitative tissue composition after 4 weeks culture at different TGF-β1 concentrations. a Representative image of the polyglycolic acid/poly-4-hydroxybutyrate scaffold sutured onto a stainless metal ring before in vitro culture. b Representative image of a hTEM after 4 weeks culture showing shiny neo-tissue deposition and homogeneous matrix distribution. c GAGs content showed slightly higher amount in patches cultured at 5 ng/ml TGF-β1. d HYP content showed similar expression values among all the different groups. e–h Representative images of H&E staining show more pronounced neo-tissue formation for hTEM cultured with TGF-β1 in comparison with the control group. i–l VGEL staining did not show any expression of elastic fibers at 4 weeks follow-up. Col-1 m–p and Col-3 q–t deposition is enhanced in hTEM cultured in the presence of TGF-β1 (scale bars 100 μm). Dot plot graphs present mean ± standard deviation (center line and bounds of error bars, respectively)

