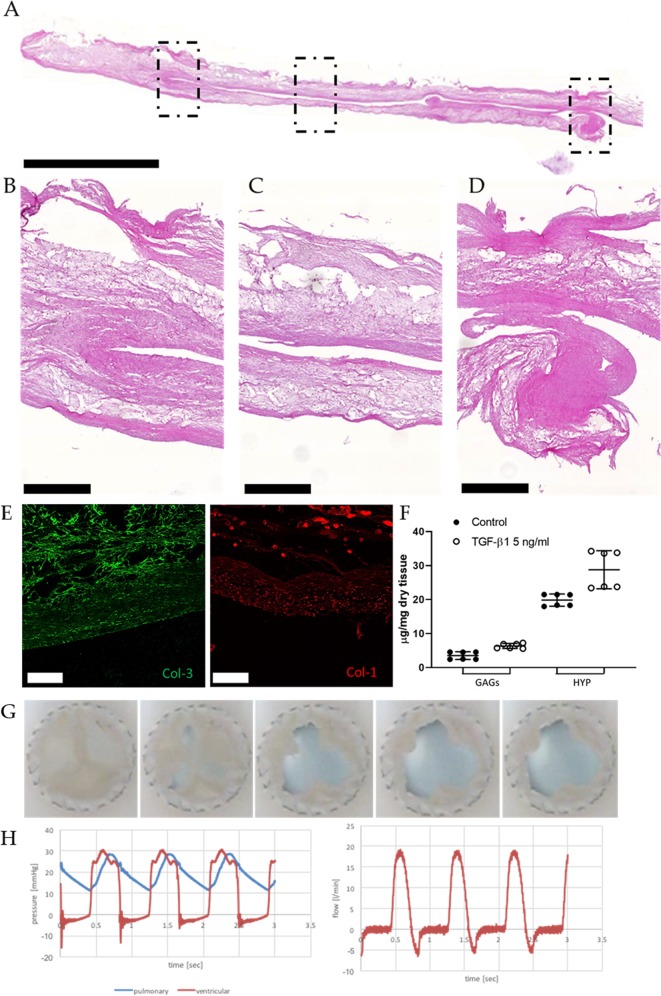
Fig. 3.
In vitro characterization of the hTESVs after 4 weeks culture. a H&E staining shows the general hTESV morphology comprising a dense collagenous matrix and the scaffold core (scale bar: 5000 μm). b–d Magnification pictures of the hinge region b, middle of the leaflet and wall c, and tip of the leaflet d marked by the dotted rectangles in a (scale bars: 500 μm). e Immunofluorescence staining shows the presence of Collagen 3 (green) and Collagen 1 (red) fibers in the newly formed matrix (scale bars: 100 μm). f Quantitative tissue composition demonstrates the slightly higher amount of GAGs and HYP in hTESV cultured in presence of 5 ng/ml TGF-β1 (white points) in comparison with control hTESV (black points). g Sequence of the opening and closing behavior of hTESVs tested in a valve pulse duplicator system for 1 hour at pulmonary pressure conditions. h Pressure and flow values for a representative hTESV after 1 hour in vitro valve testing; in the left panel, blue and red indicate pulmonary pressure and ventricular pressure, respectively; in the right panel, red indicates flow rate over time. Dot plot graphs present mean ± standard deviation (center line and bounds of error bars, respectively)

