Fig. 6.
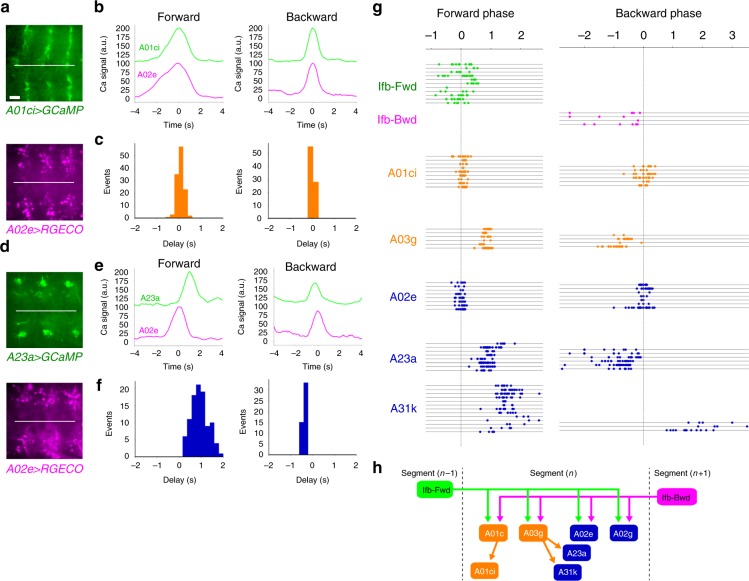
Temporal profiles of the activity of the shared module neurons. a–c Dual-color calcium imaging of A01ci and A02e. a Temporally stacked images of R75H04>GCaMP (expressed in A01ci; top) and R70C01>RGECO1 (expressed in A02e; bottom). b Plot of the calcium signal in the presynaptic sites of A01ci (green) and A02e (magenta) in the same neuromere during a forward (left) and backward (right) wave (44 forward waves and 22 backward waves from six larvae). c Histogram of the time delay in peak activity. A01ci activity compared with A02e during forward (left) and backward (right) waves. d–f Dual-color calcium imaging of A23a and A02e. d Temporally stacked images of SS04495>GCaMP (expressed in A23a; top) and R70C01>RGECO1 (expressed in A02e; bottom). e Plot of the calcium signal from presynaptic sites of A23a (green) and A02e (magenta) (71 forward waves and 23 backward waves from five larvae). f Histogram of the time delay as in (c). A23a compared with A02e. A23a follows A02e during forward waves, whereas A23a precedes A02e during backward waves. g Scatter plot of activity peaks of the shared module interneurons during forward and backward waves. The timing of the activity peaks in different neurons measured by GCaMP were plotted using the A02e activity, which was monitored by RGECO1, as a reference at each motor wave. Note that the spread of the A02e points is not always at zero phase, despite it being the reference, because peaks of GCaMP and RGECO1 signal in the same A02e do not perfectly coincide. Each horizontal line indicates a single trial. Sample size: 3–8 larvae for each neuron. h A wiring diagram of the shared module. A part of Fig. 5d is shown. Scale bar, 20 µm (a, d)

