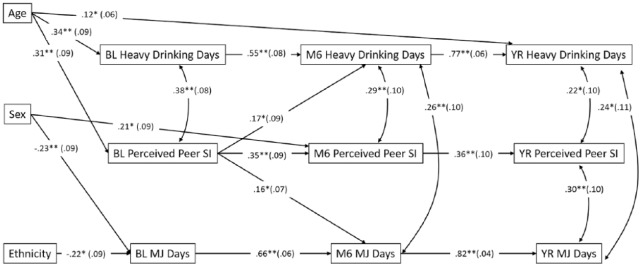
Figure 3.
Cross-lagged model estimating the longitudinal relationship among perceived peer substance involvement, adolescent marijuana days, and adolescent heavy drinking days. Significant direct paths from the best-fitting model are depicted. Parameter estimates are standardized values. Covariates (adolescent age, sex, ethnicity) were assessed at baseline. SI indicates substance involvement; BL, baseline; M6, 6-month follow-up; YR, 12-month follow-up.
N = 109.
*P ⩽ .05; **P < .01.

