
Fig.1.
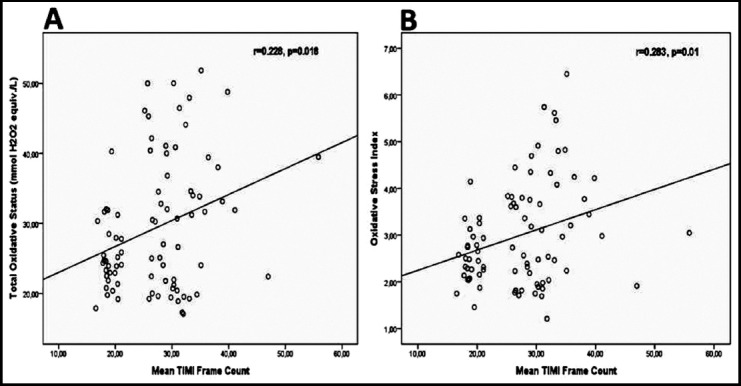
Scatter plots of correlations of total oxidative status (A) and oxidative stress index (B) biomarkers with mean TIMI frame count
Official websites use .gov
A
.gov website belongs to an official
government organization in the United States.
Secure .gov websites use HTTPS
A lock (
) or https:// means you've safely
connected to the .gov website. Share sensitive
information only on official, secure websites.
Scatter plots of correlations of total oxidative status (A) and oxidative stress index (B) biomarkers with mean TIMI frame count