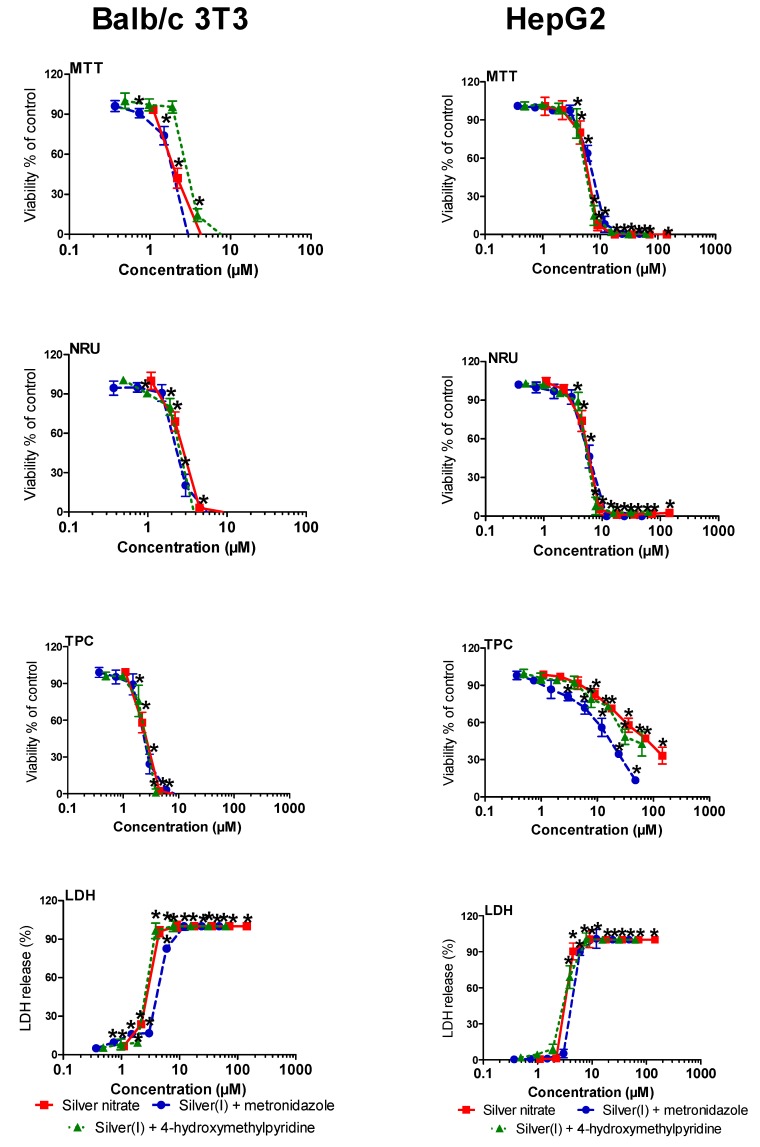
Figure 1.
Concentration-dependent response curves for study compounds assessed by MTT, neutral red uptake (NRU), total protein content (TPC) and leakage lactate dehydrogenase (LDH) assays on Balb/c 3T3 and HepG2 cells. The results are expressed as the mean ± SD of three independent experiments. * p ≤ 0.05 in comparison with negative control (0.1% DMSO).

