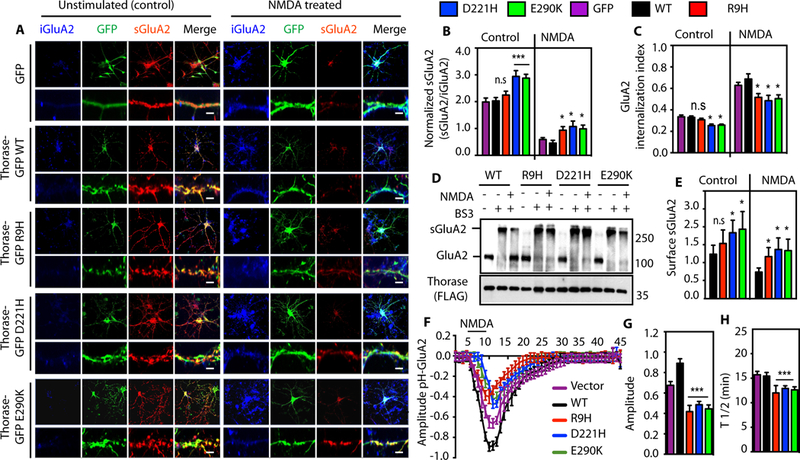
Figure 2. Variants in Thorase cause reduced endocytosis and impaired trafficking of GluA2.

(A) Representative images of unstimulated or NMDA-induced endocytosis of GluA2 in hippocampal neurons expressing GFP, Thorase-GFP wild type (WT) or variants. Lower panels are high-resolution images with scale bar = 5 μm. (B) Quantification of the ratio of surface GluA2 (sGluA2) to internalized GluA2 (iGluA2) for (A). (C) GluA2 internalization index shown in (A-B) as measured as the ratio of iGluA2 to the total GluA2 (iGluA2 plus sGluA2) fluorescence intensities. (D) Immunoblot analyses of BS3-crosslinking of sGluA2 in Thorase-heterozygous cortical neurons expressing Thorase-FLAG WT or variants. The samples were separated on 4–12% gradient SDS-PAGE and immunoblotted with anti-GluA2 and anti-FLAG. (E) The optical densitometry quantification of sGluA2 for (D) (mean ± standard error of the mean [SEM], n = 3, **p < 0.05, *p < 0.10, n.s p > 0.10, ANOVA with Holm-Sidak post-hoc test when compared with WT, Power: 1-β err prob = 0.8 – 1.0). (F) Time trace of surface pH-GluA2 fluorescence change in neurons in response to NMDA treatment. (G) Maximum amplitudes of pH-GluA2 fluorescence intensity changes to NMDA stimulation. (H) Average recycling half-time (T½, the time taken from maximum endocytosis to 50% recycling) (mean ± SEM, n = 7, **p < 0.05, n.s p > 0.10, ANOVA with Holm-Sidak posthoc test when compared with WT, Power: 1-β err prob = 1.0).
