
Figure 4. Perampanel restores behavior deficits in Thorase variant mice.
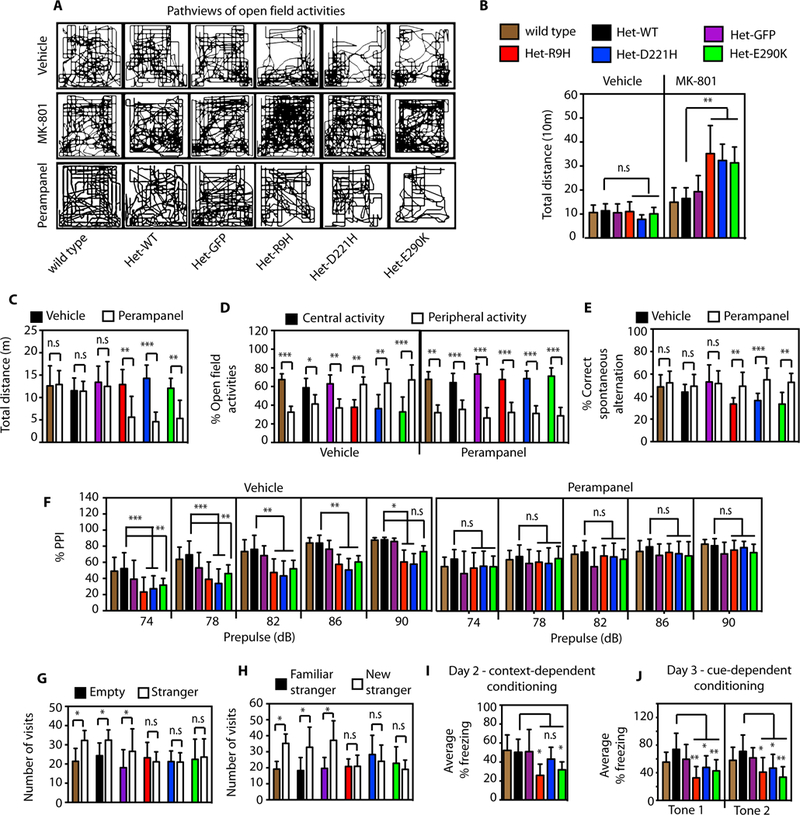
(A-D) Open field assessments in wild type and Thorase variant mice. (A) Representative pathview images of the open field activities of the mice treated with vehicle or MK-801 or perampanel showing characteristics of the patterns of locomotor activity. (B) Graphical representation of the total distance travelled by mice in the open field after vehicle or MK-801 treatment. (C) Graphical representation of the total distance travelled by mice in the open field after vehicle or perampanel treatment (mean ± SEM, n = 10, ***p < 0.01, **p < 0.05, *p < 0.1, n.s p > 0.10, ANOVA with Holm-Sidak post-hoc test when compared with wild type, Power: 1-β err prob = 0.8–1.0). (D) Percent central and peripheral activities in the open field of mice treated with vehicle or perampanel. (E) Graphical representation of percent correct spontaneous alteration of mice in the Y-maze spatial working memory tests after vehicle or perampanel treatment. (F) Prepulse inhibition (PPI) in the acoustic startle response test. The graphs represent the percent PPI at different prepulse intensity after vehicle or perampanel treatment (mean ± SEM, n = 7–10, ***p < 0.01, **p < 0.05, *p < 0.1, n.s p > 0.10, ANOVA with Holm-Sidak post-hoc test when compared with wild type, Power: 1-β err prob = 0.9 – 1.0). (G) Social interactions assessment of wild type and Thorase variant mice. Graph represents number of mice visits to chamber containing stranger mouse versus empty chamber. (H) Evaluation of social memory of controls and Thorase variant mice. Graph represents number of mice visits to chamber containing familiar stranger mouse versus chamber containing new stranger mouse. (I-J) Trace fear conditioning to assess contextual memory and associative learning in controls and Thorase variant mice. (I) Mean percent freezing of mice during the context test to assess contextual memory. (J) Mean percent freezing of mice during the cue test. Graphical representation of the average freezing time for the first 2 tones is shown. (mean ± standard error of the mean [SEM] n = 12, ***p < 0.005, **p < 0.01, *p < 0.05, Two-way ANOVA with Tukey-Kramer post-hoc test, compared with wild type, Power: 1-β err prob = 1.0).