
Fig. 3.
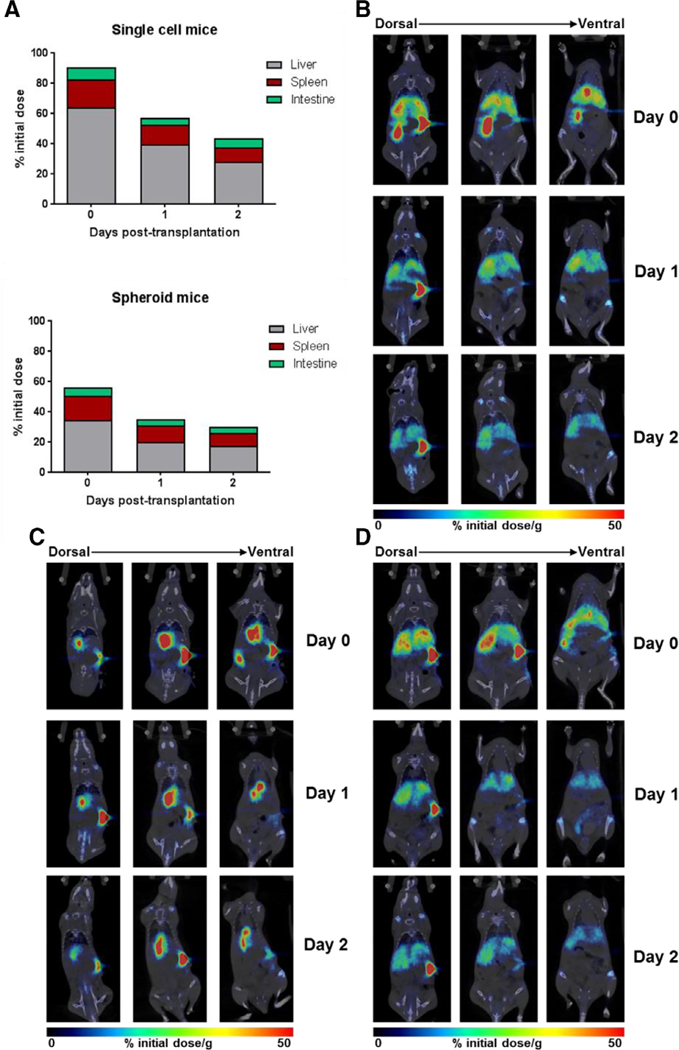
MicroPET-CT images of 89Zr-labeled single-cell and spheroid hepatocytes at 2, 24, and 48 hours post-transplantation in mice. (A) Percent of initial administered dose present in liver, spleen, and intestine at the 2-, 24-, and 48-hour time points in spheroid- and single cell-transplanted mice. (B) Coronal images of a representative single-cell-transplanted mouse, showing near homogenous distribution. (C and D) Coronal images of two representative spheroid-transplanted mice, showing intragroup differences in cell biodistribution.