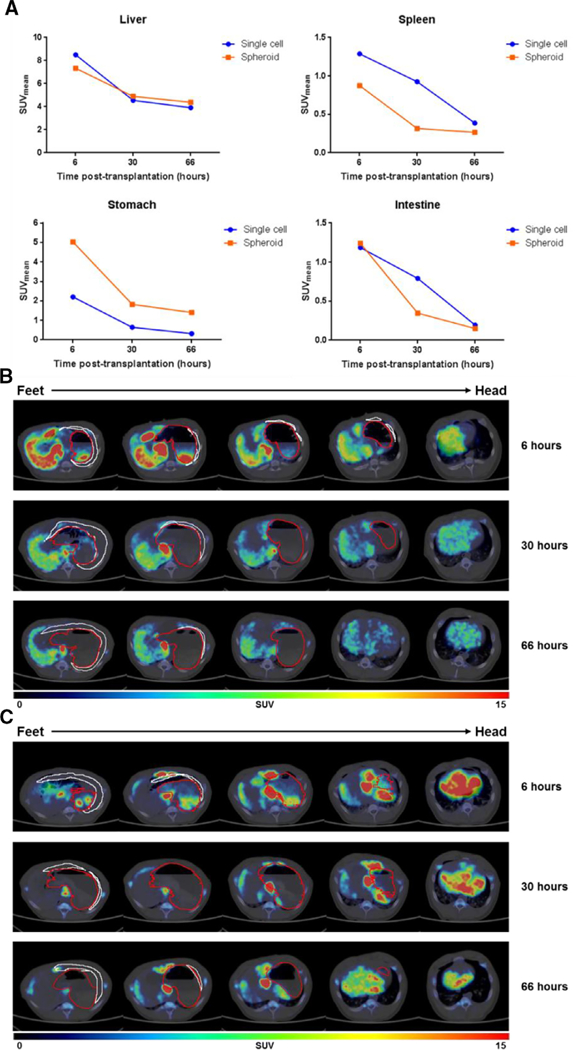
Fig. 4.

PET-CT images of 89Zr-labeled single-cell and spheroid hepatocytes at 6, 30, and 66 hours post-transplantation in pig. (A) Quantification of liver, spleen, stomach, and intestine standardized uptake values (SUV). (B and C) Axial views of five sequential PET-CT cuts in 19.6 mm slices at t 6, 30, and 66 hours after single-cell hepatocyte (B) or spheroid hepatocyte (C) transplantation in the pig. Stomach and spleen contours (outlined in red and white, respectively).
