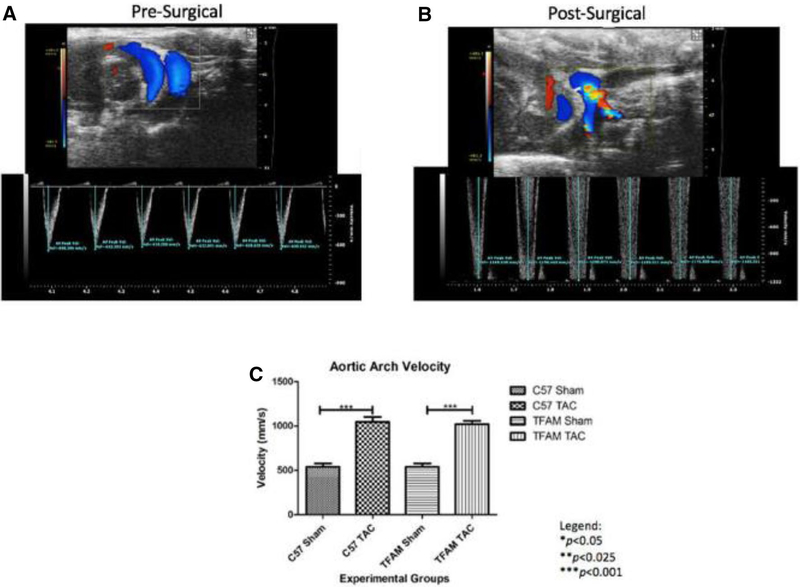
Fig. 2.
a The top, an ultrasound-echocardiographic snapshot, displays blood flow through the aorta of a particular pre-surgical mouse performed with a Vevo 2100 ultrasound pulse wave and color doppler analysis. As indicated by the blue coloration, the blood flow is rhythmically non-turbulent. Below, the respective real-time graph of AAV versus time displays a consistent AAV average value of 636.14 mm/s. b The ultrasound-echocardiographic snapshot shows blood flow through the aorta performed with a Vevo 2100 ultrasound pulse wave and color doppler analysis. As indicated by the blue-red-yellow amal gamation, the blood flow is rhythmically turbulent. The respective real-time graph of AAV versus time displays an increased AAV average value of 1184.10 mm/s from its pre-surgical value seen in 14A. c This graph displays the AAV corresponding to the specified experimental groups and the data were graphed for an N of 6 using SEM for significance. The substantial increase in aortic velocity from WT-Sham group to the WT-TAC group and the substantial increase from TFAM Sham group to the TFAM TAC group verify that the surgery worked. Values are expressed as ±SEM. N=6. ***p<0.001

