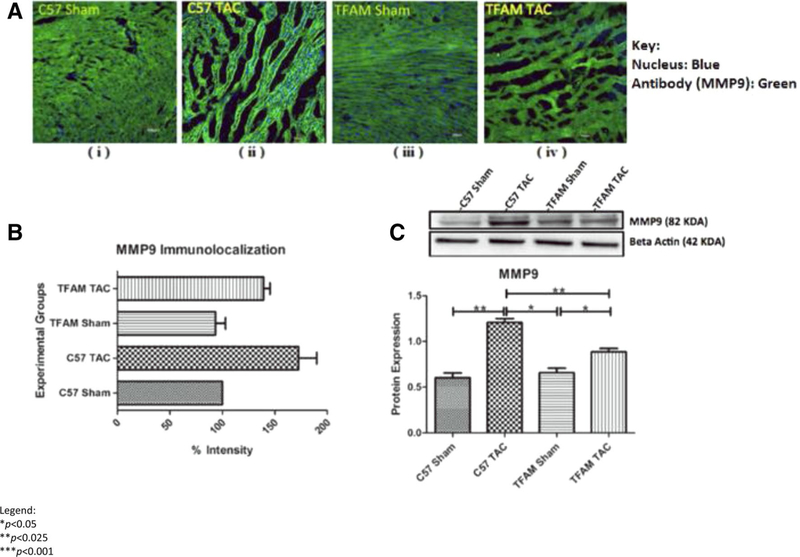
Fig. 8.
a These confocal microscopy and IHC images (i-iv) provide intra-cellular visualizations of MMP9 within the corresponding experimental groups. MMP9 is identified in green fluorescence and nuclei are identified by blue fluorescence, b This graph exhibits the fluorescent intensity of MMP9 8 weeks after TAC and was provided by the data collected from the Image J software. Each fluorescent intensity corresponds to MMP9’s presence within the specific experimental groups. With respect to MMP9 fluorescent intensity, the TFAM TAC group was shown to be significantly lower in intensity of MMP9 relative to the WT TAC group, c This graph displays MMP9 proteins expression 8 weeks after the aortic banding surgery. Lysates were analyzed by western blotting for MMP9 protein expression. The TFAM overexpression TAC group was significantly lower in protein expression of MMP9 relative to the WT TAC group. Both TAC groups were significantly increased in MMP9 protein expression when compared to their Sham counterparts. The bands were quantified using densitometry and the data were graphed for an N of 5 using SEM for significance. Values are expressed as ±SEM. N=5. *P<0.05, **P<0.025

