
Fig. 1.
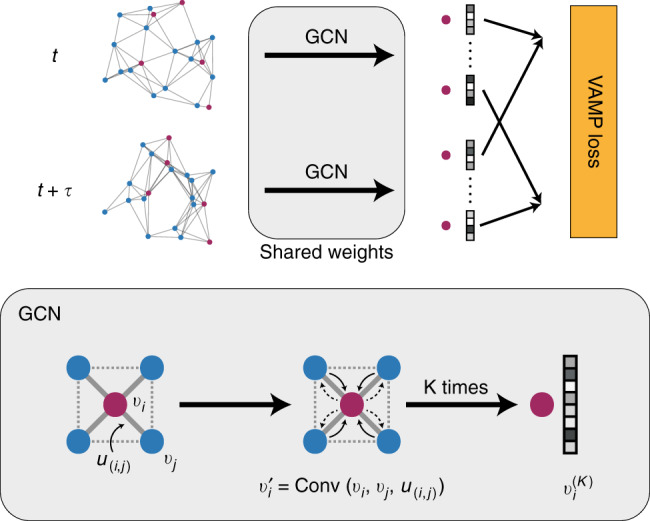
Illustration of the graph dynamical networks architecture. The MD trajectories are represented by a series of graphs dynamically constructed at each time step. The red nodes denote the target atoms whose dynamics we are interested in, and the blue nodes denote the rest of the atoms. The graphs are input to the same graph convolutional neural network to learn an embedding for each atom that represents its local configuration. The embeddings of the target atoms at t and t + τ are merged to compute a VAMP loss that minimizes the errors in Eq. (2)