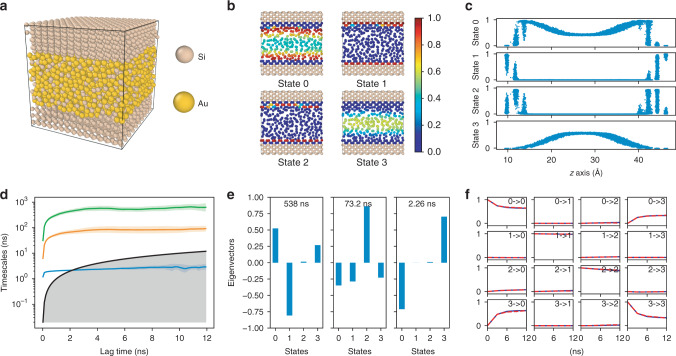
Fig. 3.
A four-state dynamical model learned for silicon atoms at a solid–liquid interface. a Structure of the silicon-gold two-phase system. b Cross section of the system, where only silicon atoms are shown and color-coded with the probability of being in each state. c The distribution of silicon atoms in each state as a function of z-axis coordinate. d Relaxation timescales computed from the Koopman models as a function of the lag time. The black lines are reference lines where the relaxation timescale equals to the lag time. e Eigenvectors projected to each state for the three relaxations of Koopman models at τ = 3 ns. f CK test comparing the long-time dynamics predicted by Koopman models at τ = 3 ns (blue) and actual dynamics (red). The shaded areas and error bars in d, f report the 95% confidence interval from five sets of Si atoms by randomly dividing the target atoms in the test data

