Fig. 3.
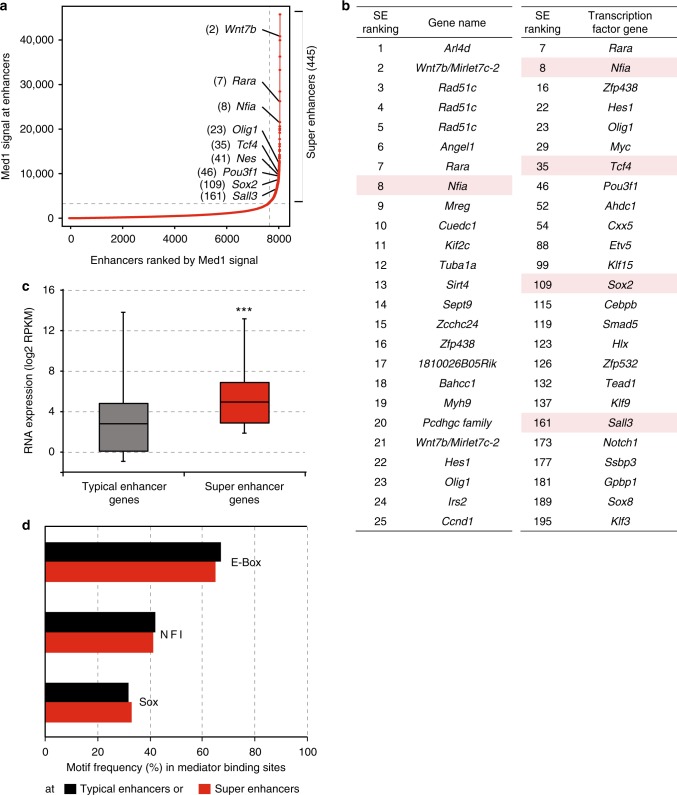
Super enhancers in neural stem cells. a Distribution of Med1 ChIP-seq signal (total reads) in enhancer regions in NSCs. 445 enhancers regions in the right upper quadrant are postulated as super enhancers. Examples of genes near super enhancers and the super enhancer rank are indicated. Source data are provided as a Source Data file. b Top 25 super enhancers (SEs) in NSCs, ranked by Mediator content, and their nearest active gene (left panel). Top 25 active transcription factor genes nearest to SEs (Right panel). SE rank is indicated. Genes encoding transcription factors that we identified as Mediator interactors are red-shaded. c Distribution of mRNA expression in NSCs of active genes nearest to SEs and active genes nearest to typical enhancers, but not nearest to SEs. Whiskers represent ultimate range. Significance of the difference in mRNA levels between two gene categories was assessed by Student t-test (***p < 0.001). Source data are provided as a Source Data file. d Most frequent transcription factor DNA motifs in Mediator-binding sites at typical enhancers and SEs. Motif frequency is indicated as the percentage of all Mediator-binding sites at typical enhancers or SEs that harbour this motif

