
Fig. 3.
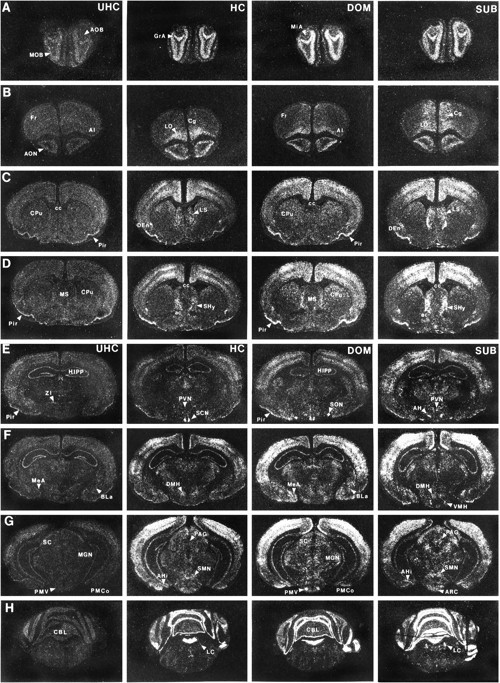
Photomicrographs illustrating the distribution of c-fos mRNA within select brain regions from animals in UHC, HC, DOM, and SUB groups.
Official websites use .gov
A
.gov website belongs to an official
government organization in the United States.
Secure .gov websites use HTTPS
A lock (
) or https:// means you've safely
connected to the .gov website. Share sensitive
information only on official, secure websites.
Photomicrographs illustrating the distribution of c-fos mRNA within select brain regions from animals in UHC, HC, DOM, and SUB groups.