
Fig. 5.
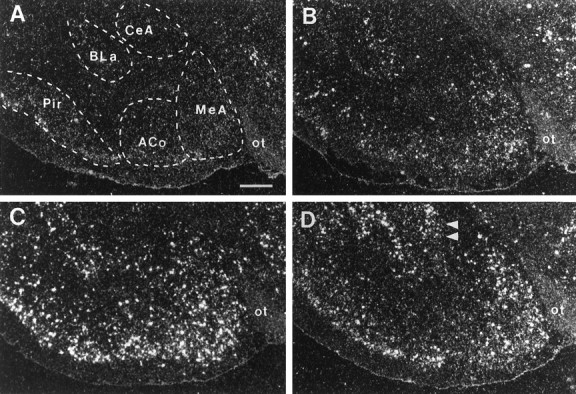
Photomicrographs illustrating the distribution of c-fos mRNA within the amygdala in UHC (A), HC (B), DOM (C), and SUB (D) groups. Scale bar, 500 μm. Note the selective increase in c-fos mRNA within the lateral portion of CeA in SUB group (D, double arrowheads).