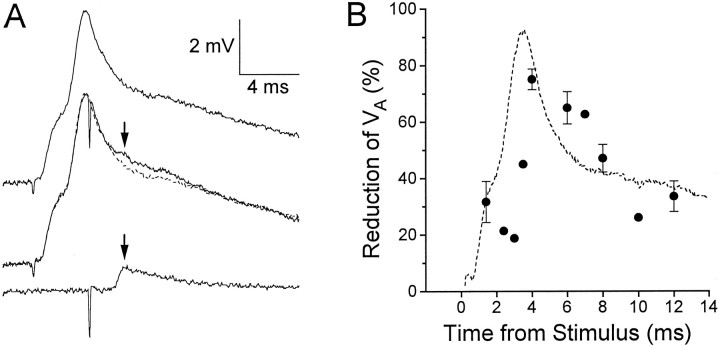
Fig. 3.
Reduction of an electrical EPSP when evoked during a root-evoked PSP. A, Top trace, Root-evoked PSP alone; bottom trace, unitary EPSP (VA) evoked by action potential in interneuron A alone; middle trace,VA evoked during a root-evoked PSP (solid trace), superimposed on the root-evoked EPSP alone (dashed trace). Arrows point to the peak of VA. Calibrations apply to all traces.B, The mean percentage reduction of theVA peak when occurring during a root-evoked PSP (as compared with VA occurring alone) at various times after the root stimulus (filled circles). Error bars represent SEM for 10 animals; some data points without error bars were obtained from only one animal. The typical time course of the root-evoked PSP is illustrated by the dashed curve.

